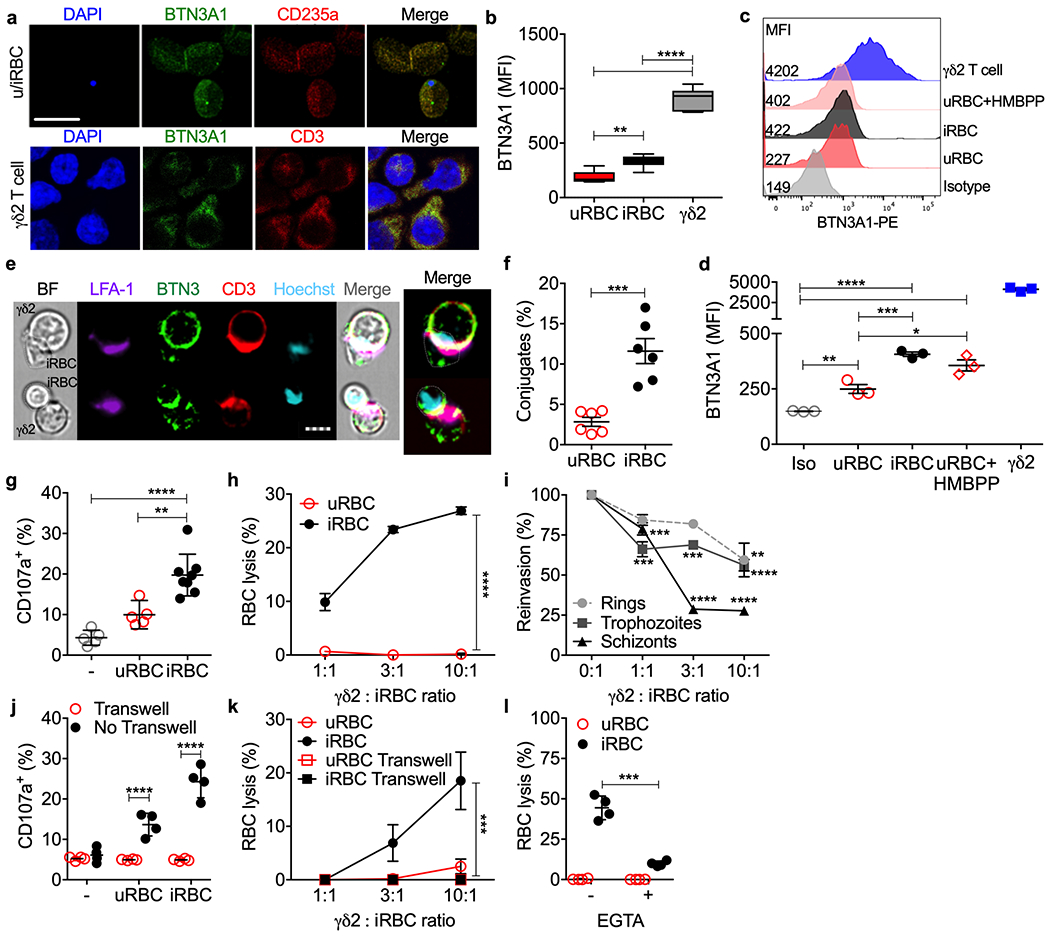
Figure 3. γδ2 T cells recognize and lyse iRBCs.

a-d, Cell surface BTN3A1 on RBCs (a, top row) and γδ2 T cells (a, bottom) imaged and quantified for 3 HD samples (b) by confocal microscopy and by flow cytometry (c,d). DAPI stains parasite DNA in iRBCs and T cell nuclei; CD235A stains glycophorin A on RBCs. An isotype control antibody (Iso) was added to a mixture of uRBCs, iRBCs, γδ2 T cells (c,d). e-i, Highly purified HD γδ2 T cells activated by culture in IL-2 and IL-15, were added to uRBCs or iRBCs to assess immunological synapse formation (e) and conjugation with uRBCs and iRBCs by imaging flow cytometry (n=6) (f), degranulation by externalized CD107a (n=5 and 8) (g), RBC lysis by flow cytometry (n=5) (h) and effect on parasite reinvasion (n=5) (i). (e) shows representative images of conjugated cells by bright field (BF) and staining for LFA-1, BTN3A1 (BTN3), CD3 and Hoechst DNA dye. In (i), parasite reinvasion was measured by flow cytometry after iRBCs synchronized at ring, trophozoite and schizont stages were cultured with or without γδ2 T cells at indicated E:T ratios. j,k, γδ2 T cells and RBCs, cultured together or separated by a Transwell membrane (n=4), were assayed for γδ2 T cell degranulation by CD107a staining (j) and RBC lysis (k). l, γδ2 T cells, pre-incubated or not with EGTA, were added to CFSE-labeled RBCs and RBC lysis was measured by flow cytometry (n=4). Scale bars: 10 μm (a), 7 μm (e). n, biological independent samples. Statistical analysis was by one-way ANOVA with Tukey’s multiple comparisons test (b,d,g), two-tailed nonparametric unpaired t-test (f), and area under the curve, followed by two-tailed nonparametric paired t-test (h), area under the curve, followed by one-way ANOVA (k) or two-way ANOVA with Sidak’s multiple comparisons test (i,j,l). Mean ± s.e.m. is shown. P value: *<0.05, **<0.01, ***<0.001, ****<0.0001. Data shown are representative of three independent experiments.
