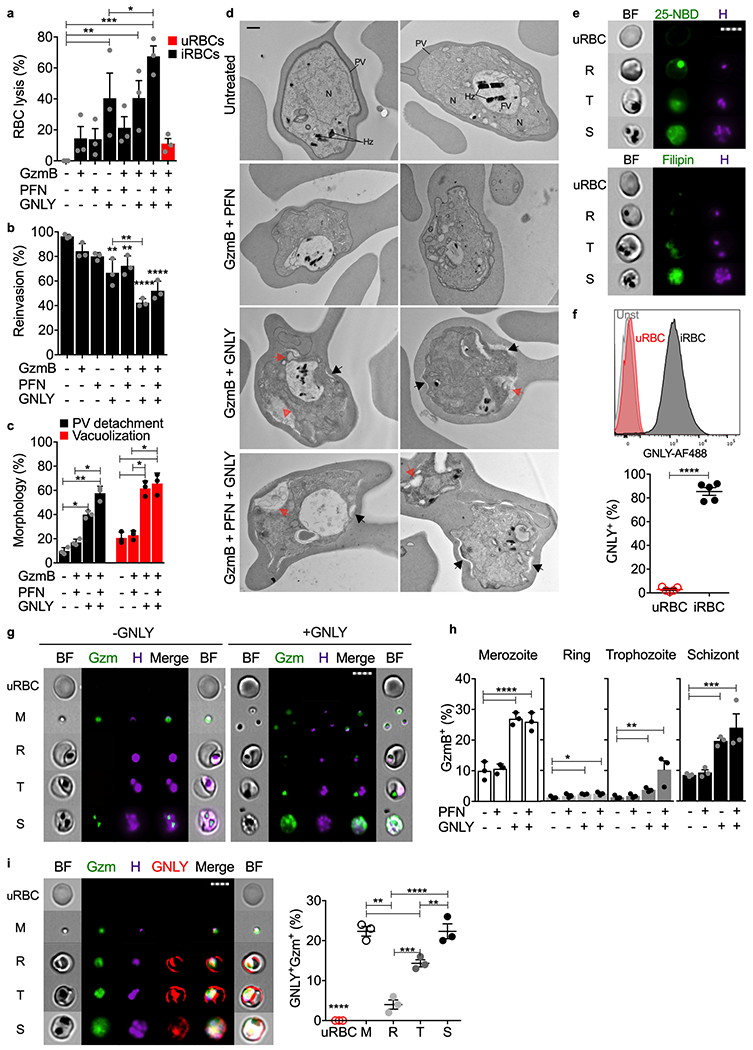
Figure 4. GNLY delivers GzmB into iRBCs to cause iRBC lysis and parasite killing.

a-c, RBCs, incubated with indicated combinations of cytotoxic effector proteins (n=3), were assayed for RBC lysis by LDH release (a), parasite reinvasion into fresh RBCs by flow cytometry (b), and parasite morphology by electron microscopy (c,d). (c) quantifies prominent morphological alterations in EM images - parasitophorous vacuole (PV) detachment (black arrows) and increased parasite vacuolization (red arrows) in 15 images from 3 sections. Parasite nucleus (N), food vacuole (FV), hemozoin (Hz) are labeled in untreated iRBCs. e, uRBCs or unsynchronized iRBCs, stained with 25-NBD or filipin as cholesterol probes and Hoechst for parasite DNA, were analyzed by imaging flow cytometry using DNA staining to gate for different parasite stages (R ring, T trophozoite, S schizont). BF, bright field, H, Hoechst dye. f, Representative histograms (top) and quantification of multiple samples (bottom) of AF647-GNLY binding to uRBCs and iRBCs (trophozoite stage) by flow cytometry (n=5). g,h, GzmB-AF488 internalization in the absence or presence of GNLY or PFN assessed by imaging flow cytometry (n=3). (g) shows GzmB-AF488 (Gzm) internalization in representative images and (h) shows the proportion of RBCs at different parasite stages that stained for GzmB in multiple experiments, n=3. i, Representative images (left) and quantification (right) of imaging flow cytometry showing RBC, uninfected or infected at indicated parasite stage, incubated with GzmB-AF488, GNLY-AF647 and unlabeled GNLY, n=3. M, merozoite; R, ring; T, trophozoite; S, schizont; H, Hoechst dye; BF, bright field; n, biological independent samples. Scale bars: 500 nm (d), 7 μm (e,g,i). Statistical analysis was by one-way ANOVA with Tukey’s multiple comparisons test (a,b,c,h,i) or two-tailed nonparametric unpaired t-test (f). Mean ± s.e.m. is shown. P value: *<0.05, **<0.01, ***<0.001, ****<0.0001. Data shown are representative of three independent experiments.
