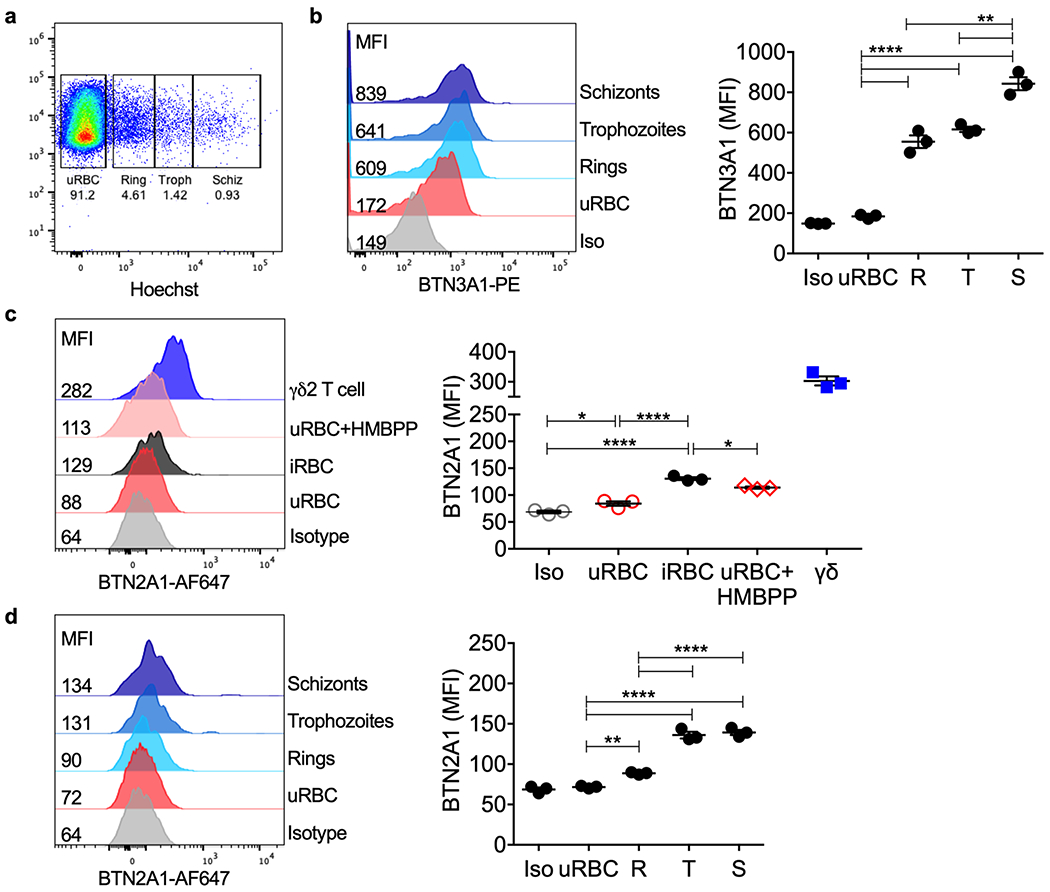
Extended Data 3. BTN3A1 and BTN2A1 expression on iRBCs.

a, Pf mixed stage culture and γδ2 T cells were stained with anti-BTN3A1, anti-BTN2A1 and Hoechst dye (DNA). Parasite stage gates were set based on RBC DNA content (rings, R; trophozoites, T; schizonts, S). b, BTN3A1 expression was plotted as median of fluorescence intensity (MFI) (n=3). c, BTN2A1 MFI in uRBCs, iRBCs, uRBCs incubated with HMBPP and γδ2 T cells (n=3). d, BTN2A1 MFI on uRBCs compared to iRBCs at different parasite stages. Isotype-stained control samples were a mixture of uRBCs, iRBCs and γδ2 T cells (n=3). In b-d, shown at left are representative histograms from 1 sample and at right are the mean ± s.e.m. of 3 independent experiments. Iso, isotype control. n, biological independent samples. Statistical analysis was by one-way ANOVA with Tukey’s multiple comparisons test. P value: **<0.01, ***<0.001, ****<0.0001. Data shown are representative of at least three independent experiments
