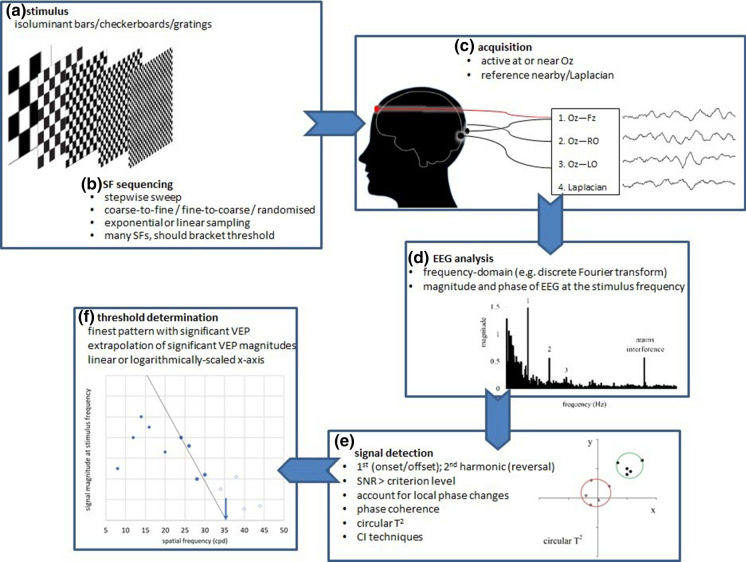
Fig. 1.
Illustrative overview of processes used to measure VEP SF limits. Panel a/b illustrates options for stimuli (gratings or checkerboards) and sequencing. Panel c illustrates a possible four-channel acquisition montage with one channel emulating the ISCEV VEP standard, Oz–Fz [1], two using closely positioned reference electrodes over the right occiput (RO) and left occiput (LO) (Oz–RO and Oz–LO) and the fourth using a Laplacian montage, Oz–((RO + LO)/2). Panel d illustrates an example of frequency domain analysis, with steady-state VEPs evident as the numbered spikes at the stimulus frequency and higher harmonics. Panel e illustrates one signal detection technique, the circular T2 (red circle encloses the origin and represents a non-significant steady-state VEP; green circle excludes the origin and illustrates a significant steady-state VEP)—other statistical techniques are also listed. Panel f illustrates one method for defining VEP SF limit, namely linear regression and extrapolation of the significant VEP magnitudes in the descending limb at the finest spatial frequencies: alternative methods are listed. SF, spatial frequency; SNR, signal-to-noise ratio; CI, confidence interval; cpd, cycles per degree

