
Fig. 2.
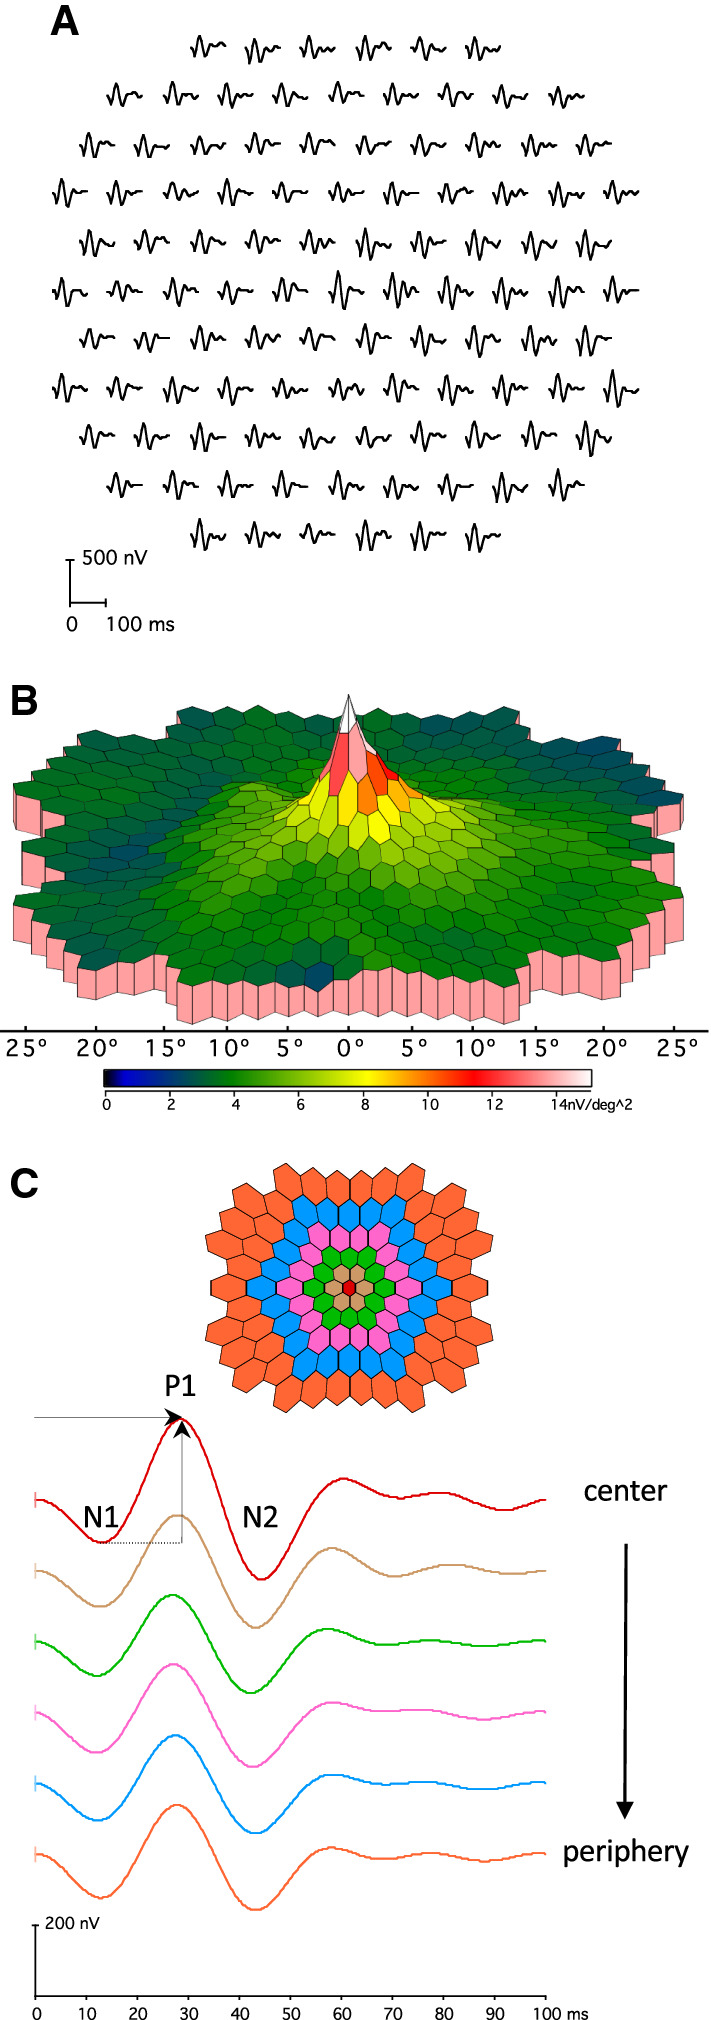
Sample mfERG recording obtained to a stimulus array containing 103 elements. A Traces (left eye; field view) from different eccentricities are arranged in an equidistant manner for clear visualization and comparison, while the actual stimulus array is scaled (see Fig. 1b). B 3D-response density plot (field view). Overall signal strength is given per unit area of retina. C Ring-averages. MfERG traces from the concentric hexagons were averaged within six different eccentricity ranges (see color coding in stimulus schematic) and arranged vertically from center to periphery. MfERG peak definitions (N1, P1, and N2) and P1-amplitude (trough to peak, vertical arrow) and P1-peak time (horizontal arrow) measures are indicated for the foveal response. The horizontal broken line corresponds to the trough of the N1 component