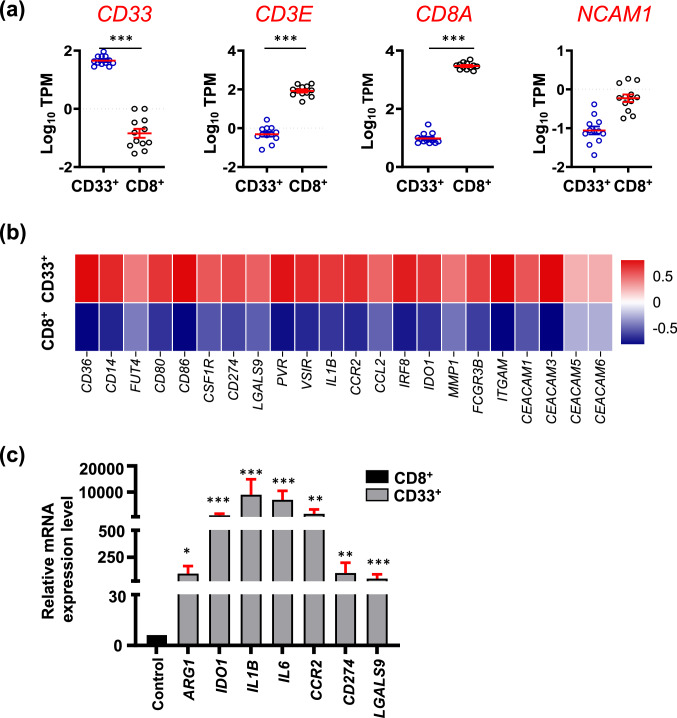
Fig. 2.
Transcriptome analyses confirming the phenotypic and functional characteristics of sorted CD33+ myeloid cells. Tumor tissues from CRC patients were used to sort highly pure CD33+ myeloid cells and CD8+ T cells (used as controls), and differential gene expression analyses were performed on RNA-Seq data. Scatter plots show gene expression levels as the mean of Log10 TPM ± standard error of the mean (SEM) for CD33, CD3E, CD8A and NCAM1 (gene for CD56) genes (a). Heatmap represents the fold change in gene expression levels of myeloid phenotypic and functional markers in CD33+ vs. CD8+ cells as Z-scores, which were calculated from TPM values (b). Bar plot shows the mRNA expression levels of ARG1, IDO, IL1B, IL6, CCR2, CD274 and LGALS9 in CD33+ cells normalized to CD8+ cells (used as controls), analyzed by qRT-PCR. The relative expression of each gene was calculated by normalization with β-actin. Mean + standard error of the mean (SEM) is shown in red (c). Statistical significance was calculated using non-parametric paired t-test; *P < 0.05; ***P < 0.001

