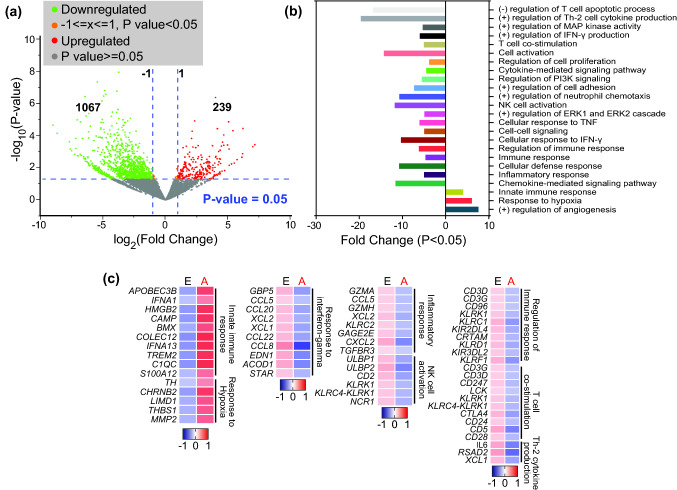
Fig. 3.
Transcriptome analyses of differentially expressed genes in tumor-infiltrating CD33+ myeloid cells in CRC patients with early and advanced stage. We divided the patients into two groups based on disease stage; early stage (stages I and II, n = 8) and advanced stage (stages III and IV, n = 5), to compare their transcriptomic data. Volcano plot shows overall differentially regulated genes in patients with advanced stage compared to patients with early stage; red dots represent upregulated, green dots represent downregulated and gray dots represent genes, which remained unchanged with P values as a function of fold change and indicate the vertical dotted line to delimit > twofold change and P < 0.05 cutoffs (a). Bar plot shows functional annotations for the genes that were significantly upregulated or downregulated in CD33+ myeloid cells from advanced vs. early stages (b). Heatmaps show the Z-scores for various up- or downregulated genes and associated pathways in advanced vs. early stages (c)

