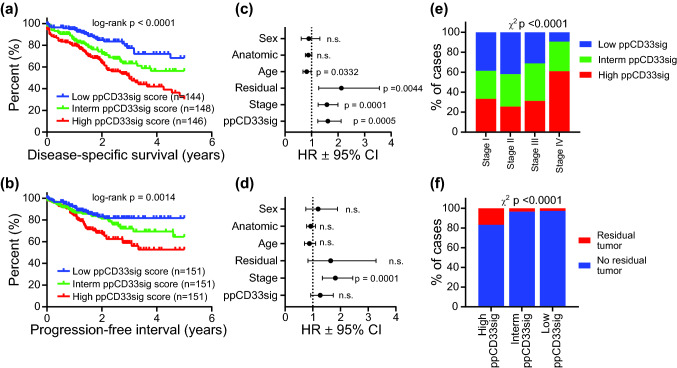
Fig. 5.
The prognostic significance of ‘poor prognosis CD33+ gene signature’ (ppCD33sig) in the TCGA CRC dataset. Selected genes were used to determine the ppCD33sig score, calculated as the ratio of the average expression of the 55 upregulated genes to the average of the 42 downregulated genes. The ppCD33sig was evaluated in the TGCA CRC RNA-Seq dataset. Disease-specific survival (a) and progression-free interval (b) were compared between patients with high (top 33%), intermediate (middle 33%) or low (bottom 33%) ppCD33sig scores. The number (n) of patients in each of ppCD33sig groups and the Log-rank P value from Mantel–Cox test (GraphPad Prism v8.4) are indicated. Multivariate analyses using Cox proportional-hazard model (MedCalculator v12.7) comparing the ppCD33sig (high, interm, low), disease stage (Stages IV, III, II, I), residual disease (yes, no), age (< 55, 55–64, 65–74, > 74 years of age), anatomic locations (7 different locations), and sex (male, female) for disease-specific survival (DSS) (c) and progression-free interval (PFI) (d). Data shown are the hazard ratio (HR) ± 95% confidence interval (CI) and the multivariate P values are indicted (n.s.: not significant) (c, d). Distribution of patients with high, intermediate, or low ppCD33sig scores across disease stages (e). The presence of residual disease in patients with different ppCD33sig scores (f). Stated P values are from Chi-square (χ2) test was used

