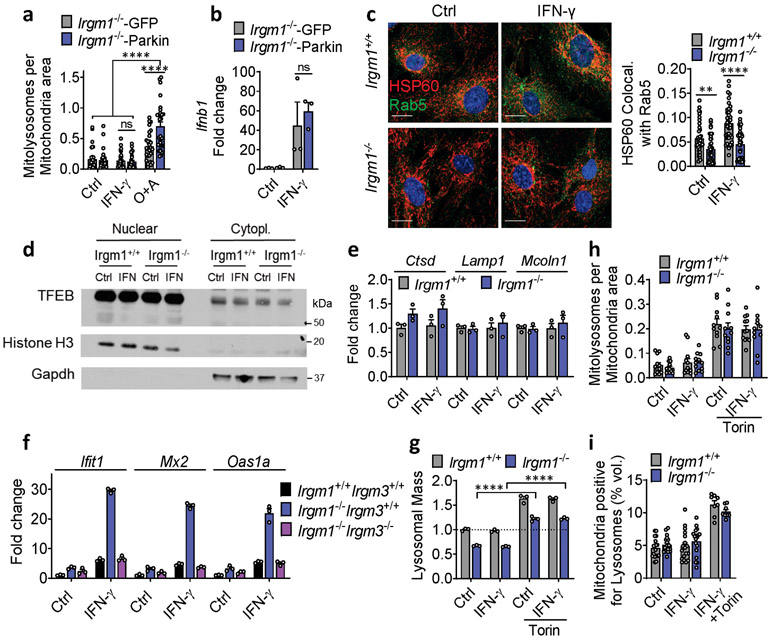
Extended Data Fig. 4. Deficient mitophagic flux in Irgm1−/− MEFs.
a, GFP-Parkin-expressing Irgm1−/− MEFs transduced with mt-mKeima and analyzed for mitolysosome signals. GFP vector served as transduction control. Oligomycin and Antimycin A (O+A; 10 μM each for 5-6h) were used as positive control for mitophagy (n=30 for Irgm1−/−-GFP, Irgm1−/−-Parkin treated with IFN-γ or O+A, n=28 for Irgm1−/−-GFP treated with O+A, n=31 for Irgm1−/−-GFP treated with IFN-γ and n=27 for Irgm1−/−-Parkin control conditions). b, PARKIN-expressing (and GFP control) MEFs assessed for Ifnb1 expression by qPCR (n=3). c, MEFs treated with or without IFN-γ were stained for mitochondria (HSP60) and endosomes (Rab5) and analyzed for colocalization (Mander’s coefficient shown at right) (n=38 fields) (scale bar, 20 μm). d, Nuclear and cytoplasmic fractions were isolated and stained for TFEB. Nuclear Histone H3 and cytoplasmic GAPDH serve as fraction markers. e, Expression of lysosomal biogenesis genes in MEFs (n=3). f, Immortalized MEFs of indicated genotypes were assessed by qPCR for expression of ISGs (Ifit1, Mx2, and Oas1a) (n=3). g, LysoTracker fluorescence fold change in MEFs treated with Torin1 (1 μM, 8h) (n=3). h, Mitophagy measured in mt-mKeima-expressing MEFs treated with Torin1 (n=11). i, Mitochondrial volume colocalizing with lysosomes analyzed by live-imaging of MitoTracker and LysoTracker-stained MEFs (n=18 for all conditions, except n=8 for IFN-γ +Torin). Surface rendering was performed in Imaris software for volumetric analysis. a, d, f and g are representative of two independent experiments. b, e and h are representative of three independent experiments. c and i are combination of three independent experiments. Data are mean +/− s.e.m. *P < 0.05, **P < 0.01, ****P < 0.0001, ns=not significant.Two-tailed unpaired t-test.

