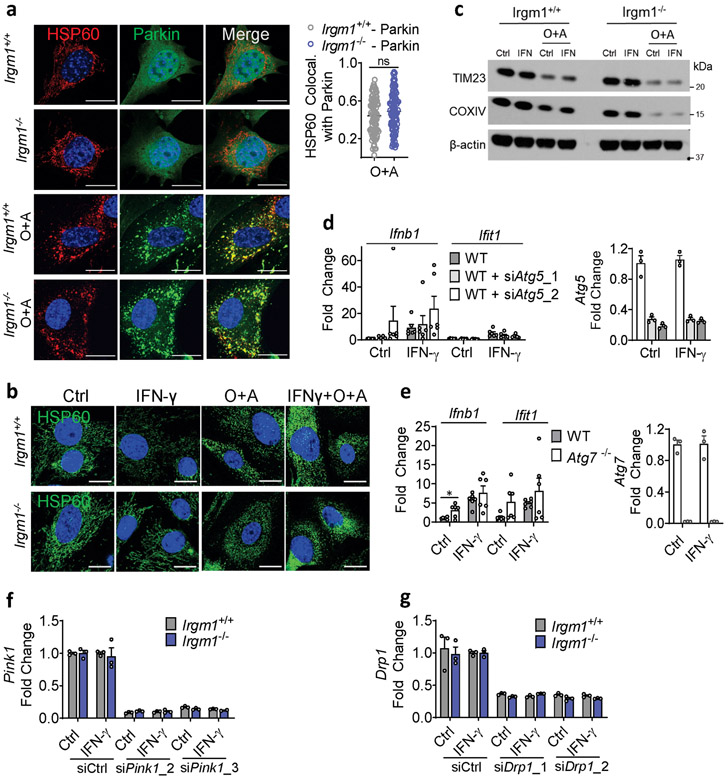
Extended Data Fig. 5. Mitophagy controls in Irgm1−/− MEFs.
a, YFP-Parkin expressing MEFs treated with Oligomycin and Antimycin A (O+A, 10 μM each for 6h), stained for HSP60 and analyzed for colocalization (Mander’s coefficient; right panel) of HSP60 with Parkin (n=85 for Irgm1+/+-Parkin and n=100 for Irgm1−/−-Parkin cells) (scale bar, 20 μm). b,c, MEFs treated with O+A analyzed for mitochondrial fragmentation by HSP60 staining (b) and for mitochondrial protein expression (TIM23, COXIV, actin control) by Western blot (c) (scale bar, 20 μm). d, WT MEFs underwent Atg5 silencing with two siRNAs (or control siRNA), were untreated or treated with IFN-γ, and then analyzed by qPCR for Ifnb1, Ifit1, and Atg5 (n=6). e, WT and Atg7−/− MEFs were treated as shown and then analyzed by qPCR for Ifnb1, Ifit1, and Atg7 (n=6). f,g, Silencing efficiency for siRNAs against Pink1 (n=3) (f) and Drp1 (n=3) (g). b, c, f, and g are representative of at least two independent experiments. a, d, and e are combinations of two independent experiments. Data are mean +/− s.e.m. ***P < 0.001, ns = not significant. Two-tailed unpaired t-test.

