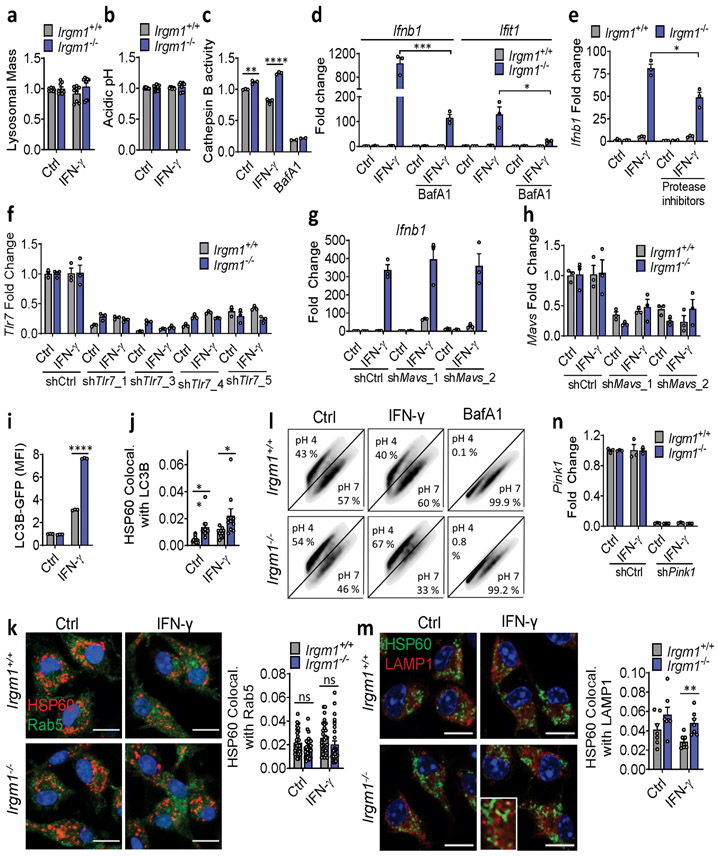
Extended Data Fig. 9. Role of lysosome and mitochondrial cargo in type I IFN response of Irgm1−/− macrophages.
a, Lysosomal mass analyzed by LysoTracker staining (n=9). b, Relative acidic pH measured by ratiometric Lysosensor yellow/blue dye (n=9). c, Cathepsin B activity assessed by Magic red substrate (n=3). Bafilomycin (BafA1) is used as negative control. d,e, qPCR for indicated targets in BMDM pretreated prior to IFN-γ with BafA1 (100 nM, 2h) (d) or co-treated with protease inhibitors (20 μM E64d, 50 μM pepstatin A) and IFN-γ (e) (n=3). f-h, BMDM silenced for Tlr7 using four different lentiviral shRNAs (or control shRNA) and analyzed for Tlr7 expression (f); silenced for Mavs using two different shRNAs and analyzed for Ifnb1 (g) or Mavs expression (h) (n=3). i, Mean fluorescence intensity (MFI) of LC3-GFP transgenic WT and Irgm1−/− BMDM after washing with 0.05% saponin (n=3). Release of LC3-I was confirmed by microscopy showing only punctate LC3-II signal (not shown). j, BMDM stained for mitochondria (HSP60) and endogenous LC3, expressed as Mander’s coefficient of colocalization (n=10). k, BMDM analyzed for colocalization of HSP60 and endosome (Rab5) (n=30). l, mt-mKeima-expressing BMDM analyzed for mitophagy by flow cytometry using ratiometric measurements at 488 (pH 7) and 561 nm (pH 4) lasers with 610/20 nm emission and 600 nm long pass filters. m, BMDM analyzed for HSP60 and LAMP1 colocalization (n=7). n, Evaluation of knockdown of Pink1 in BMDM (n=3). a and k are combination of three independent experiments. b is combination of two independent experiments. c, d, i, j, l, and m are representative of three independent experiments. e-h and n are representative of two independent experiments. All scale bars are 10 μm. Data are mean +/− s.e.m. #P = 0.06, *P < 0.05, **P < 0.01, ****P < 0.0001, ns = not significant. One-way ANOVA or two-tailed unpaired t-test.

