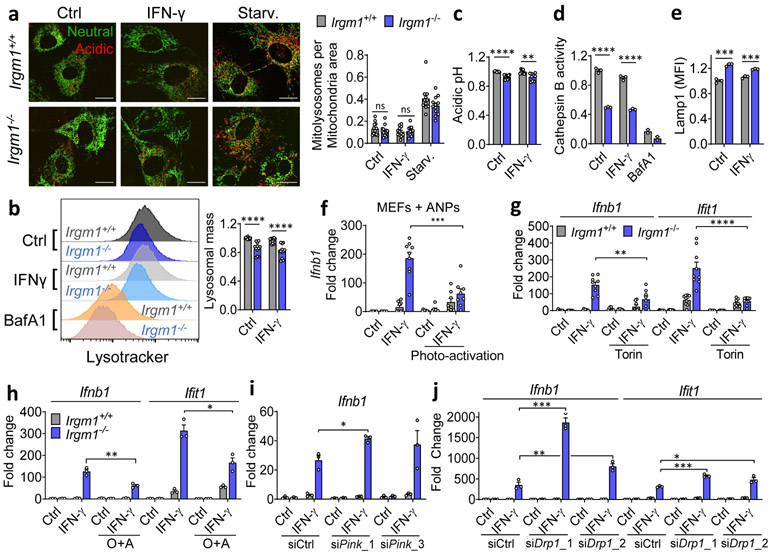
Figure 4: Mitophagic flux deficit drives type I IFN response in Irgm1-null fibroblasts.
a, Mitochondria (mt)-mKeima-expressing murine embryonic fibroblasts (MEFs) (representative images, left) analyzed for pixel area in red channel (acidic mitolysosomes), normalized to signal in green channel (total mitochondria) (scale bar, 20 μm). MEFs were untreated, treated with IFN-γ, or starved (Starv.) by incubation in HBSS buffer. Quantification at right (n=12). b, Lysosomal mass assessed by LysoTracker fluorescence in flow cytometry. Representative histogram at left, quantification at right (n=12). c, Relative acidic pH measured by ratiometric Lysosensor yellow/blue dye (n=9). d, Cathepsin activity measured by cleavage of Magic Red substrate (n=3). Bafilomycin A1 (BafA1, 100 nM) was used as negative control in (b) and (d). e, LAMP1 fluorescence measured by flow cytometry (MFI, mean fluorescence intensity) (n=3). f, Interferon-β (Ifnb1) expression in MEFs preloaded with photoactivatable acidic nanoparticles (aNPs), treated with IFN-γ and then exposed to UV light (n=9). g,h, Ifnb1 and Ifit1 expression in MEFs co-treated with IFN-γ and 1 μM Torin1 (n=9) (g) or Oligomycin + Antimycin (O+A, 10 μM each) (n=3) (h). i, j, Ifnb1 and Ifit1 expression in MEFs transfected with two different siRNAs against Pink1 (n=3) (i) or Drp1 (n=3) (j) or control siRNA followed by treatment as shown. b, c, d and e are expressed as fold change of MFI. a, h and j are representative of three independent experiments. c, e, and i are representative of two independent experiments. b, d, f and g are pooled from at least three independent experiments. Data are mean +/− s.e.m. *P < 0.05, **P < 0.01, ***P < 0.001, ****P < 0.0001 (Two-tailed unpaired t-test).

