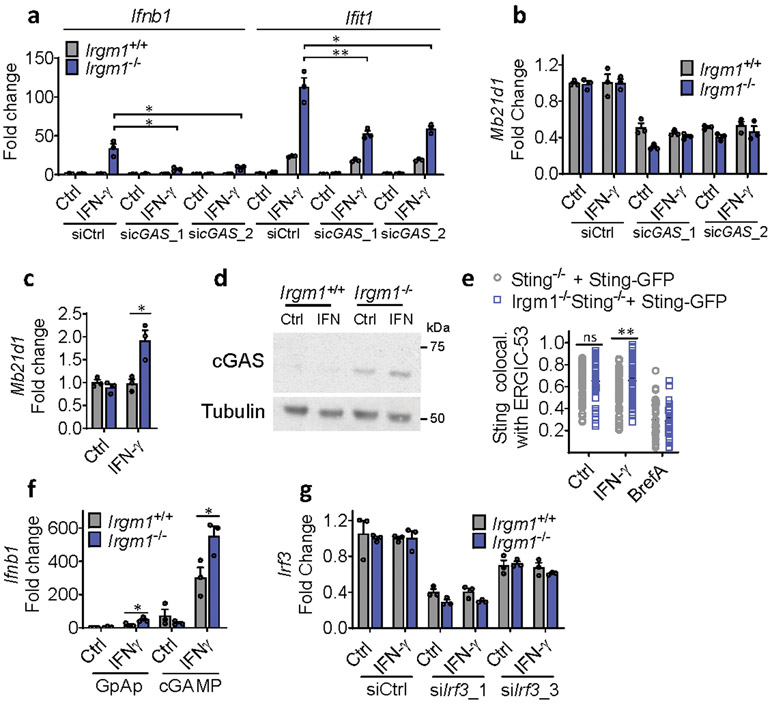
Extended Data Fig. 3. cGAS/STING/IRF3 axis in type I IFN response of Irgm1−/− MEFs.
a, Interferon-β (Ifnb1) and Ifit1 expression in murine embryonic fibroblasts (MEFs) transfected with two different siRNAs against cGAS or control siRNA and then treated as shown (n=3). b, Mb21d1 qPCR confirmation of siRNA silencing (n=3). c,d, Mb21d1 expression measured by qPCR (n=3) (c) and cGAS by Western blot (d) in MEFs. e, Sting−/− (i.e., Tmem173−/−; n=53 for control, n=62 for IFN-γ and n=44 for Brefeldin A [BrefA] conditions) and Irgm1−/−Sting−/− (n=49 for control, n=70 for IFN-γ and n=36 for BrefA conditions) MEFs transduced with Sting-GFP were analyzed for colocalization (Mander’s coefficient) of GFP with ER-Golgi intermediate complex (ERGIC)-53. Brefeldin A (2 μg/ml) treatment was used as negative control. f, Ifnb1 expression in MEFs treated with IFN-γ and then transfected with 2 μg/ml cyclic-GAMP or linear GpAp negative control (n=3). g, qPCR confirmation of Irf3 silencing by siRNA (n=3). a-d and f-g are representative of at least two independent experiments. e is combination of two independent experiments. Data are mean +/− s.e.m. *P < 0.05, **P < 0.01. Two-tailed unpaired t-test.

