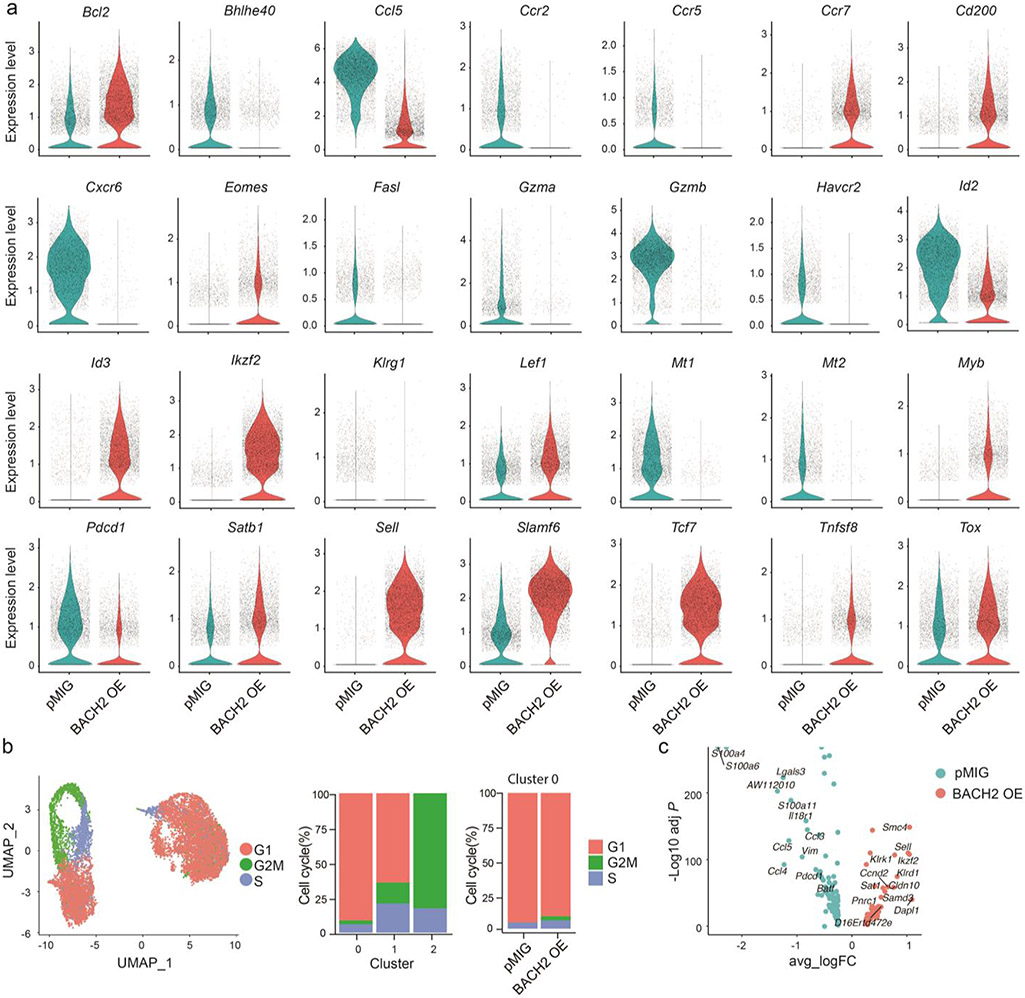
Extended Data Figure 3. ScRNA-Seq analyses of pMIG and BACH2 OE P14 cells.
a, Violin plots illustrating the mRNA amounts of differentially expressed genes between pMIG (iris blue) and BACH2 OE (red) P14 cells on day 7 p.i.. b, Left panel: UMAP projection of P14 cells colored by cell-cycle phases (G1: red; S: blue; G2/M: green). Middle panel: percentages of cells in different cell-cycle phases from each cluster defined in Fig. 3c. Right panel: percentages of cells in cluster 0 pMIG P14 cells or cluster 0 BACH2 OE P14 cells that are in different cell-cycle phases. c, Volcano plots showing differentially expressed genes between cluster 0 pMIG P14 cells and cluster 0 BACH2 OE P14 cells.

