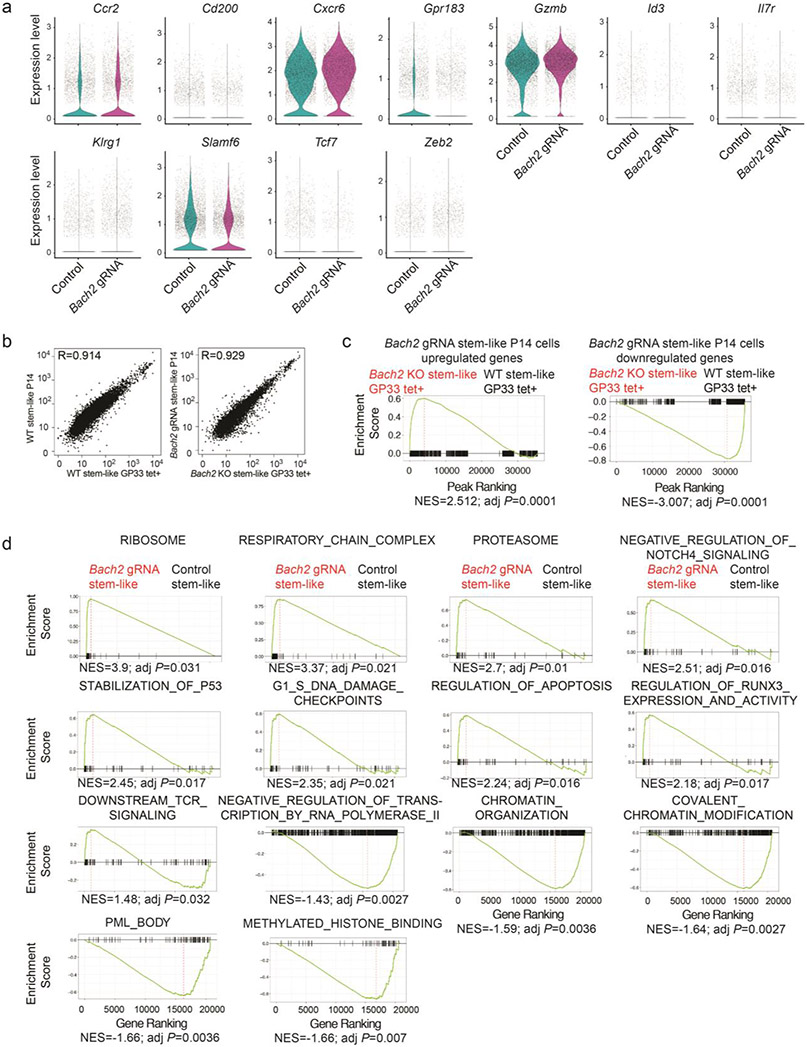
Extended Data Figure 6. Transcriptome analysis of control and Bach2 gRNA transduced P14 cells.
a, Violin plots illustrating the mRNA amounts of differentially expressed genes between control (iris blue) and Bach2 gRNA (purple) transduced P14 cells on day 7 p.i.. Each dot represents one cell. b, Correlation between WT GP33 tetramer+ stem-like CD8+ T cells and control stem-like P14 CD8+ T cells (left) or between Bach2 KO GP33 tetramer+ stem-like CD8+ T cells and Bach2 gRNA stem-like P14 CD8+ T cells (right). 3 independent samples per condition. c, GSEA of RNA-Seq data from WT and Bach2 KO GP33 tetramer+ stem-like CD8+ T cells shows the enrichment of gene sets containing genes upregulated (left) or downregulated (right) in Bach2 gRNA transduced stem-like P14 cells relative to control stem-like P14 cells. d, Significantly enriched pathways in Fig. 6h determined by GSEA.

