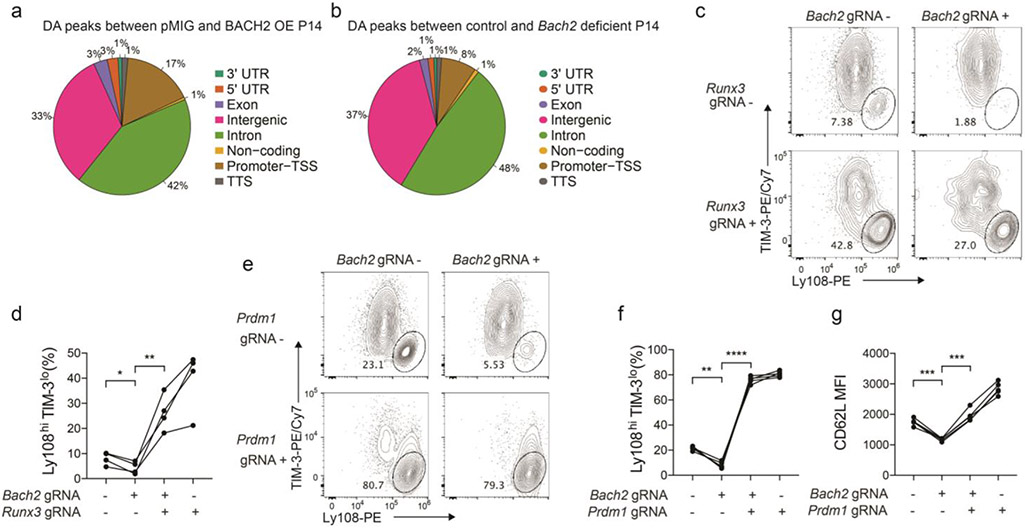
Extended Data Figure 7. The molecular program downstream of BACH2.
a, Experimental setup has been described in Fig. 7a. A pie chart illustrates the genomic distribution of differentially accessible (DA) regions between pMIG and BACH2 OE stem-like P14 cells. b, Experimental setup has been described in Fig. 7f. A pie chart illustrates the genomic distribution of DA regions between control and Bach2 gRNA transduced stem-like P14 cells. c,d, Cas9; P14 CD8+ T cells co-transduced with pMKO GFP vector expressing Bach2 gRNA and SL21 VEX vector expressing Runx3 gRNA were adoptively transferred into C57BL/6 mice that were subsequently infected with LCMV clone 13 (n=4 mice). Splenic P14 cells were analyzed on day 7 p.i.. c, Representative FACS plots of Ly108 and TIM-3 expression on GFP−VEX−, GFP+VEX−, GFP−VEX+, and GFP+VEX+ P14 CD8+ T cells. d, Percentage of stem-like (Ly108hiTIM-3lo) cells within GFP−VEX−, GFP+VEX−, GFP−VEX+, and GFP+VEX+ P14 CD8+ T cells. e-g, Cas9; P14 CD8+ T cells co-transduced with pMKO GFP vector expressing Bach2 gRNA and SL21 VEX vector expressing Prdm1 gRNA were adoptively transferred into C57BL/6 mice that were then infected with LCMV clone 13 (n=5 mice). Splenic P14 cells were analyzed on day 7 p.i.. Representative FACS plots of Ly108 and TIM-3 expression on GFP−VEX−, GFP+VEX−, GFP−VEX+, and GFP+VEX+ P14 CD8+ T cells (e) and percentage of stem-like (Ly108hiTIM-3lo) cells within GFP−VEX−, GFP+VEX−, GFP−VEX+, and GFP+VEX+ P14 cells (f) are shown. g, CD62L expression on GFP−VEX−, GFP+VEX−, GFP−VEX+, and GFP+VEX+ P14 cells. Data in c-g are representative of at least two independent experiments. Circles represent individual mice. Lines in d,f,g connect data points from the same individual mice. Statistical significance in d,f,g was calculated with a two-sided Student’s paired t-test. *P < 0.05, **P < 0.01, ***P < 0.001, ****P < 0.0001.

