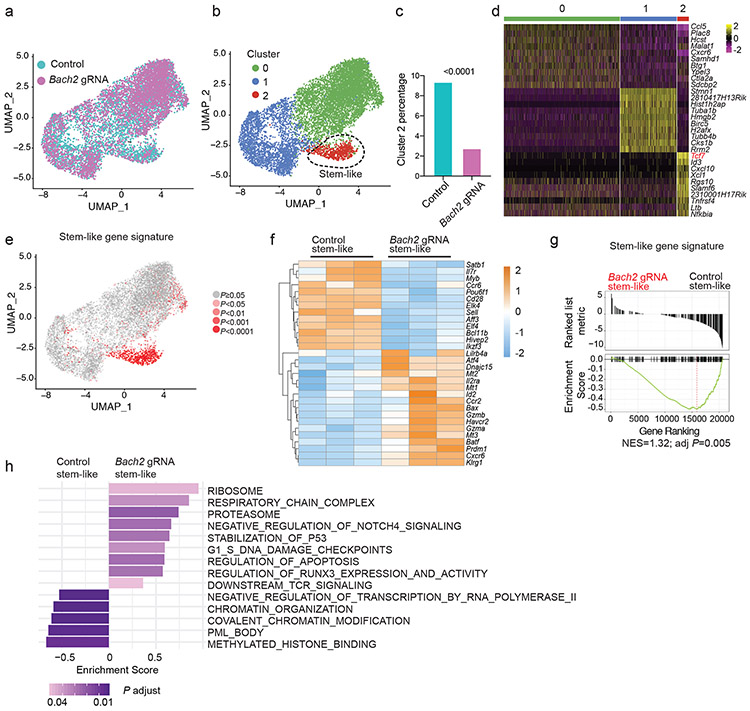
Fig.6 ∣. BACH2 is required for the transcriptional program of stem-like CD8+ T cells.
Experimental setup is the same as in Fig. 5b. a-e, scRNA-Seq was performed with control and Bach2 gRNA transduced P14 CD8+ T cells on day 7 p.i.. a, UMAP projection of control (iris blue, n=5,457) and Bach2 gRNA (Magenta, n=4,579) transduced P14 CD8+ T cells. Each dot represents one cell. b, Unsupervised clustering identified three subsets (clusters 0-2) of P14 CD8+ T cells. c, Percentages of cells in cluster 2 in control and Bach2 gRNA transduced P14 cells. Statistical significance was determined by one-sided Chi-squared test. ****P < 0.0001. d, A heatmap of the top 10 genes expressed in each cluster defined in Fig. 6b. e, Feature plot illustrating enrichment (log2 P values) of stem-like gene signature in each cell. Each dot represents one cell. P values were determined by a one-sided Fisher’s exact test. f-h, RNA-Seq was performed with stem-like (Ly108hiTIM-3lo) control (n=3 independent samples) and Bach2 gRNA (n=3 independent samples) transduced P14 CD8+ T cells on day 7 p.i.. f, A heatmap of representative differentially expressed genes (fold change >1.5, FDR < 0.05) between control and Bach2 gRNA transduced stem-like P14 cells. Each column represents an independent sample. The color scale is based on z-score distribution. FDR is determined by edgeR. g, Enrichment of stem-like gene signature in BACH2-deficient versus control stem-like P14 CD8+ T cells determined by GSEA. NES, normalized enrichment score; adj P, adjusted P value. h, GSEA by clusterProfiler illustrating gene sets upregulated or downregulated in Bach2 gRNA transduced stem-like P14 cells relative to controls.

