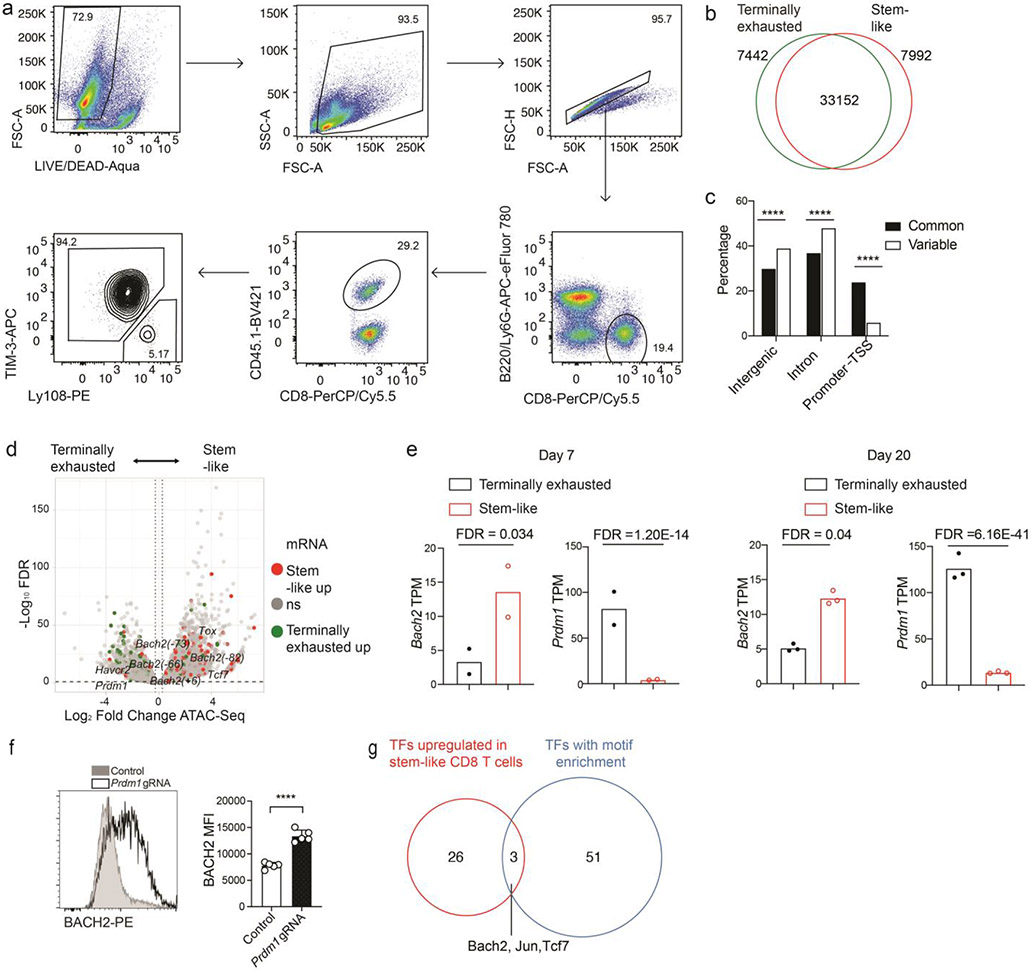
Extended Data Figure 1. Stem-like and terminally exhausted CD8+ T cells exhibited distinct open chromatin landscapes.
a, Experimental setup has been described in Fig. 1a. Gating strategy for sorting stem-like (Ly108hiTIM-3lo) and terminally exhausted (Ly108loTIM-3hi) P14 cells on day 7 p.i.. b, Venn diagram illustrating the numbers of ATAC-Seq peaks in stem-like and terminally exhausted CD8+ T cells. c, Percentages of common and variable ATAC-Seq peaks, as defined in Extended Data Fig.1b, annotated to Intergenic, Intronic, and Promoter-TSS regions. Filled bars represent common peaks; unfilled bars represent variable peaks. P values were determined by the Chi-squared test. d, Volcano plots of differentially accessible chromatin regions between stem-like and terminally exhausted CD8+ T cells are shown. The x axis represents log2 fold change of chromatin accessibility; the y axis represents −log10FDR. The horizontal dash line indicates FDR=0.1; vertical dash lines indicate fold change of +/− 1.2. Dots represent peaks associated with significantly upregulated genes (fold change >1.5, FDR <0.05) in stem-like (red) or terminally exhausted (green) CD8+ T cells, and non-significantly regulated genes (grey). FDR is calculated by edgeR. ATAC-Seq data include n=2 independent experiments per group. e, The transcript abundance of Bach2 and Prdm1 in stem-like and terminally exhausted P14 CD8+ T cells harvested on day 7 (left, n=2 independent samples) and day 20 (right, n=3 independent samples) after LCMV clone 13 infection are shown in bar graphs. FDR was determined using edgeR. f, Cas9; P14 CD8+ T cells transduced with control or Prdm1 gRNA constructs were adoptively transferred into C57BL/6 mice that were subsequently infected with LCMV clone 13. Splenic P14 cells were analyzed on day 7 p.i.. The protein expression of BACH2 in control or Prdm1 gRNA transduced P14 CD8+ T cells are shown in representative FACS plot (left) and bar graph (right). g. A Venn diagram shows transcription factors (TFs) upregulated in stem-like compared to terminally exhausted CD8+ T cells (red) and TFs with motif enriched in the differentially accessible chromatin regions between stem-like and terminally exhausted CD8+ T cells (blue). Statistical significance in f was calculated with a two-sided Student’s t-test. ****P < 0.0001.

