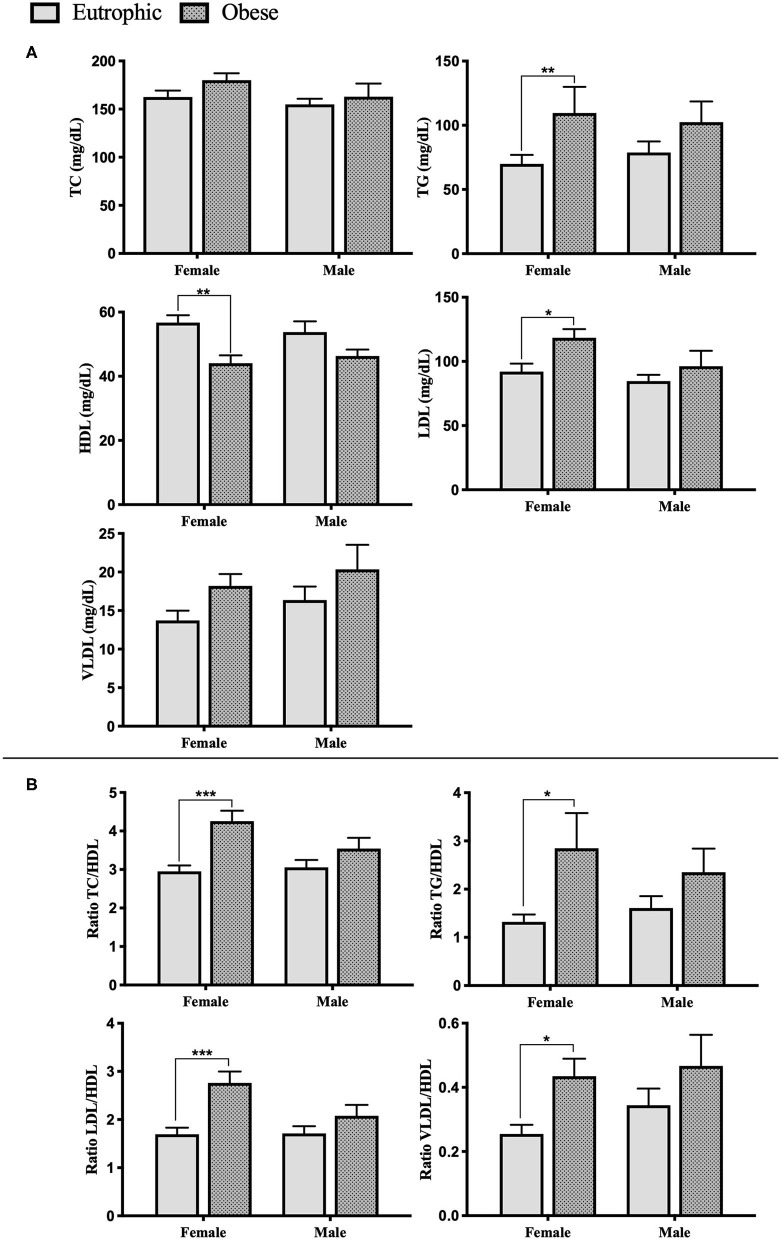
Figure 2.
Serum lipid profile of enrolled patients. (A) Serum lipid and lipoproteins levels. (B) Cardiovascular diseases prediction ratios. Eutrophic female, n = 24; Eutrophic male, n = 25; Obesity female, n = 22; Obesity male, n = 21. TC, Total Cholesterol; TG, Triglycerides; HDL, high-density lipoprotein cholesterol; LDL, low-density lipoprotein cholesterol; VLDL, very-low-density lipoprotein cholesterol. Data presented as mean ± sem. Significance between the groups was tested using the Tukey's post–test; *p < 0.05; **p < 0.005; ***p < 0.001.

