FIGURE 6.
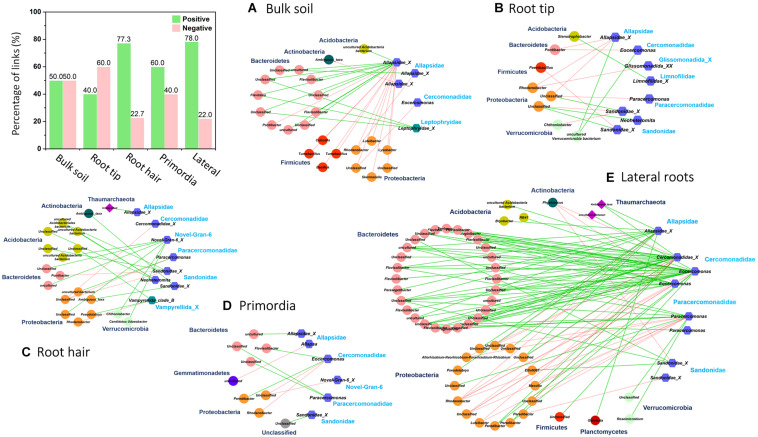
Bipartite microbial co-occurrence networks based on correlation analysis of bacteria (circles), archaea (rhombuses), and Cercozoa (hexagons) in (A) bulk soil and four different root regions of increasing age with (B) root tip, (C) root hair zone, (D) lateral root primordial, and (E) lateral roots. Node colors were mapped to the phylum level. Only positive (green edges) or negative (red edges) correlations of Cercozoa with bacteria or archaea were displayed. Nodes were clustered on family level based on their current taxonomy. The bar plot shows the percentage of positive and negative correlations between Cercozoa and bacteria/archaea in bulk soil and at the different root regions.

