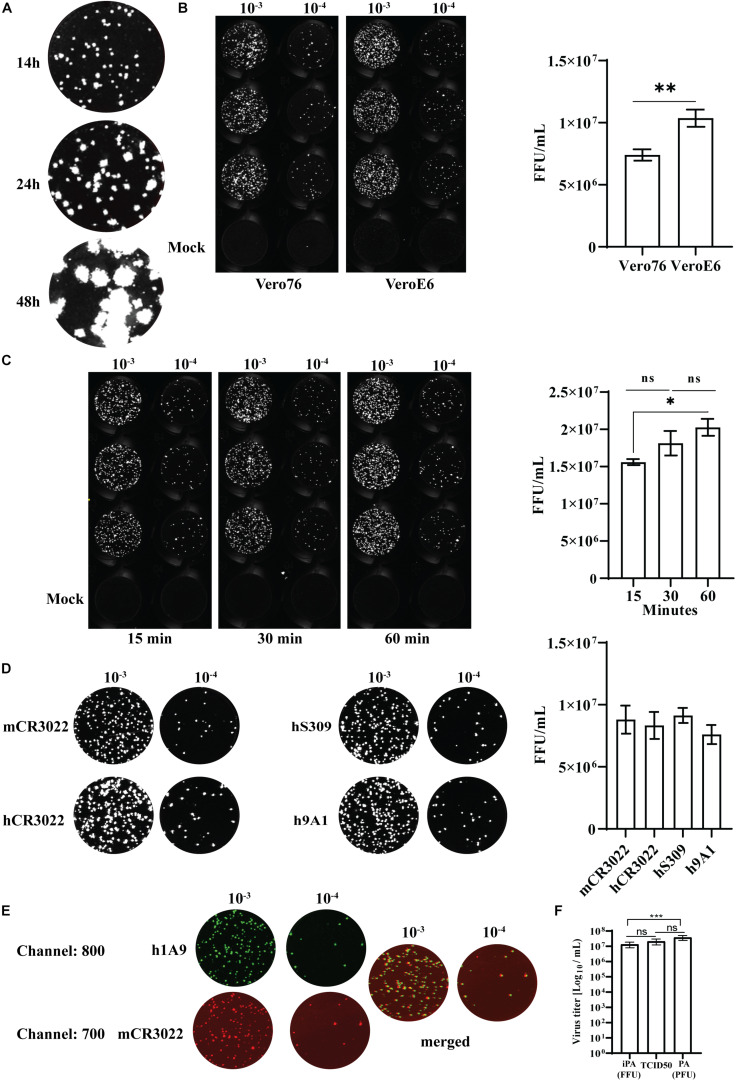
FIGURE 8.
Optimization of an immuno-plaque assay for SARS-CoV-2. (A) A representative image of immuno-plaque sizes from infected cells fixed at different time points. (B) Comparison of the viral titer of the same viral stock on Vero76 and VeroE6. Left, representative images of immuno-plaque assay (iPA) performed on Vero76 and VeroE6. Right, virus titer calculated from the left. (C) Left, representative images of viral titers comparing different adsorption periods to infect the cells. Right, virus titer calculated from the left. (D) Representative images of viral titer of the same stock comparing different primary mAbs. Right, virus titer calculated from the left. (E) Representative images of co-staining of infected cells with two different mAbs (mCR3022 and h1A9). (F) Virus titer assessed by optimized iPA, TCID50, and standard plaque assay. The P-values for panels (A) and (C) (*p < 0.05, **p < 0.01) were calculated by using the Mann–Whitney U test. The p-values for panel (F) (***p < 0.001) were calculated by one-way analysis of variance with the Tukey multiple-comparisons test. The data presented are the mean of two or three independent experiments, where each was performed in technical duplicate or triplicate. Error bars are presented as means ± SEM.

