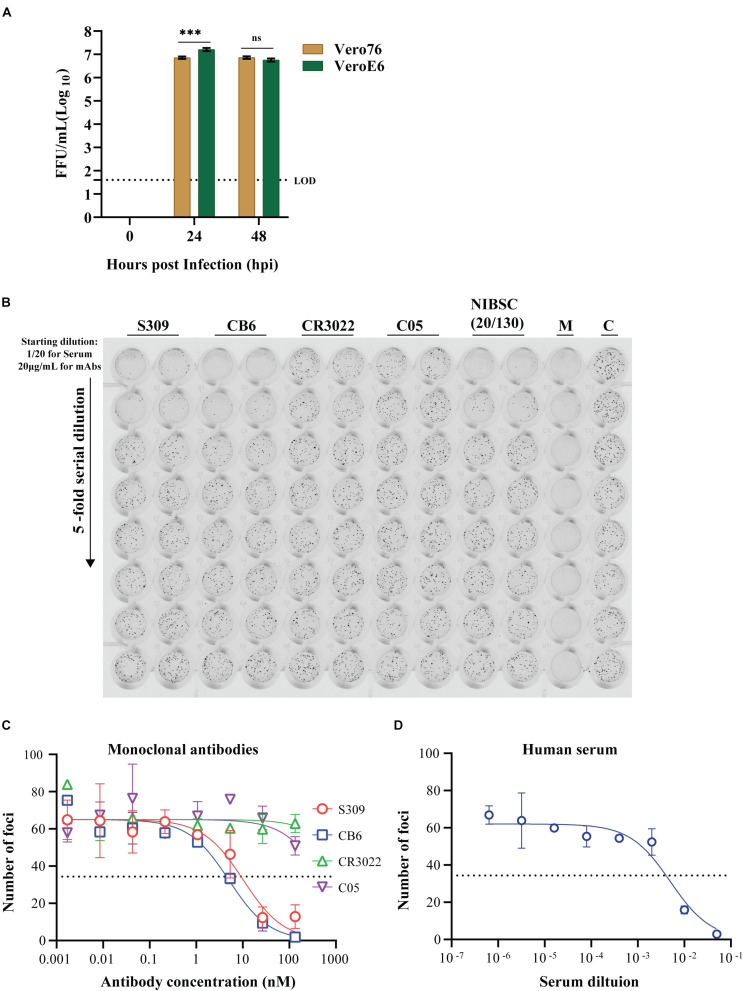
FIGURE 9.
Utility of the immuno-plaque assay to determine the viral titer and neutralizing antibody levels for SARS-CoV-2 in a 96-well plate format. (A) Growth kinetics comparison of SARS-CoV-2 on Vero76 and VeroE6. Viral titers were determined on VeroE6. The p-value (***p < 0.001) for growth kinetics was determined by multiple comparison using two-way ANOVA test with Sidak’s correction. The data presented are the mean of three independent experiments, where each was performed in duplicate. Each focus counted per well of sample is then expressed as focus-forming units per milliliter (FFU/ml), and the theoretical limit of detection was determined by the detection of a single immuno-plaque in undiluted sample, which corresponds to 40 FFU/ml for a 96-well plate format. (B) Scanned image showing the immuno-plaques from plaque reduction neutralization test (PRNT) for mAbs and NIBSC control serum. (C,D) Neutralizing antibody levels for mAbs and NIBSC control serum by PRNT. The data presented is representative of three independent experiments, where each was performed in technical duplicate. The IC50 or ID50 values for each antibody and NIBSC control serum are shown in Table 1. For PRNT, to determine the IC50 value, the best-fit curve was tested using non-linear regression and the inhibitor vs. response (three parameters) model. The level of statistical significance was set at 95% (p = 0.05), and error bars are presented as means ± SEM. M and C correspond to the well containing media only or virus only, respectively.

