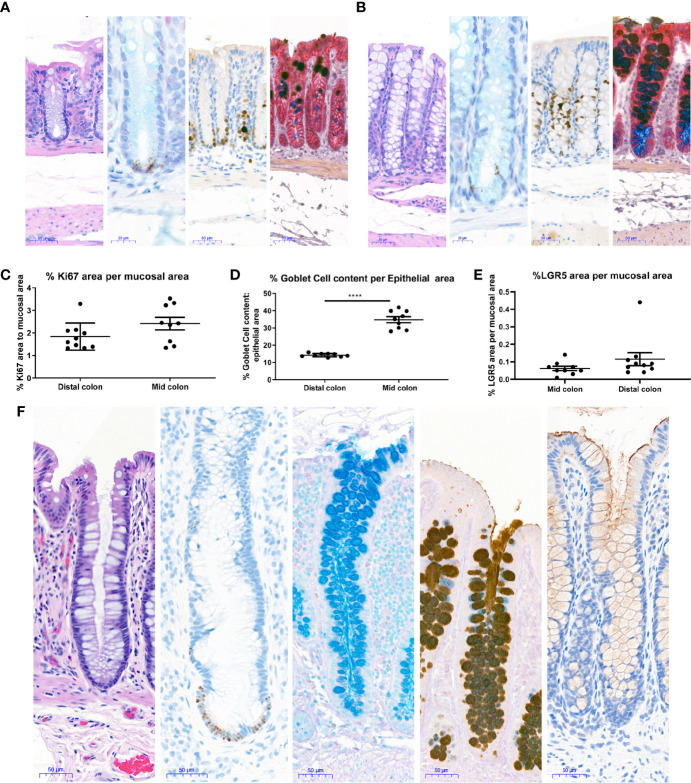
Figure 4.
Histological characterization of mouse and human colons. Distal and Mid colons were collected from naïve male C57BL/6N mice and paraffin-embedded for staining. Serial sections were stained for [(A) (distal colon) and B (mid colon), from left to right] H&E, In situ hybridization for LGR5 as a stem cell marker (black dots at base of crypt) with Alcian blue counterstain for mucus and nuclei, the proliferation marker Ki67 with hematoxylin counterstain (nuclei), dual Immunohistochemistry for Gob5/CLCA1 to label a subset of Goblet cells (dark brown) and GPA33 for epithelial cells (red) was counterstained with Alcian blue-PAS to capture all goblet cells. In (A, B), representative 20x images are shown and scale bars indicate 50 microns for all images except LGR5 ISH, where scale bars indicate 20 microns. Images in A are from the distal colon and images in (B) are from the mid colon. Stained mouse colons were used for automated quantification to determine the percent Ki67 positive area per mucosal area (C), percent goblet cell area per epithelial area (D), and percent LGR5 positive area per mucosal area (E). Each data point represents the quantification of an image from an individual mouse. Ranges and averages were similar across three independent experiments. Data from one representative study in nine naïve mice is shown. Statistical significance was determined by unpaired t-test. In (F), 20X images show representative staining of a colon from a healthy human for (from left to right) H&E, in situ hybridization for LGR5 (black dots) with hematoxylin counterstain (nuclei), Alcian blue to show Goblet cell content, immunohistochemistry for Mucin 2 counterstained with Alcian blue-PAS to capture all goblet cells, and immunohistochemistry for Mucin 1 (brown) with hematoxylin counterstain (nuclei). Scale bars indicate 50 microns for all images. ****P < 0.001.

