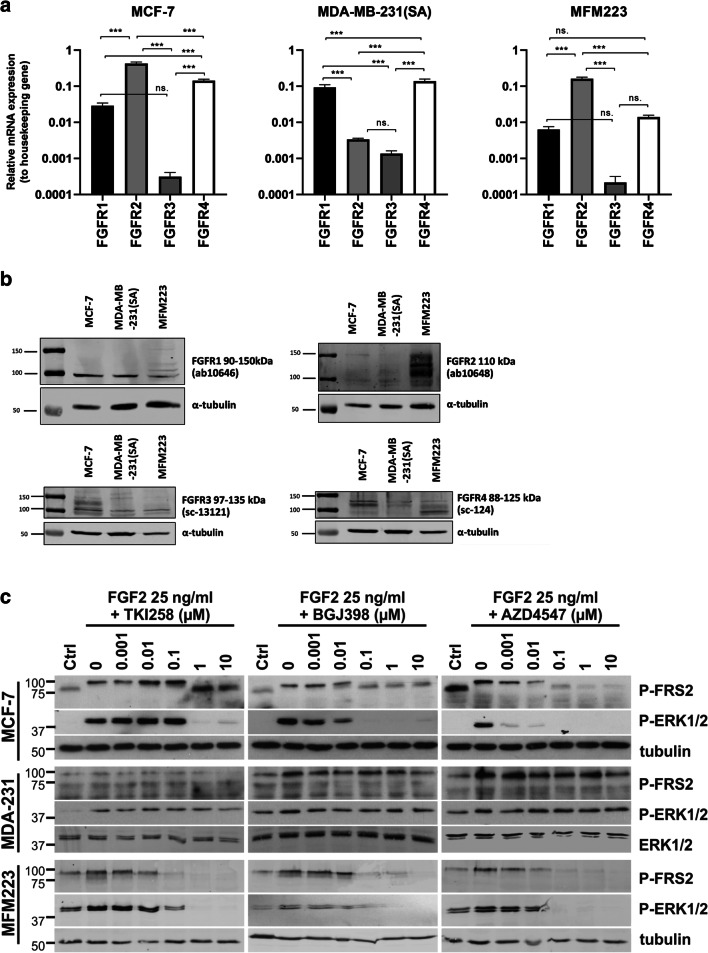
Fig. 1.
FGFR expression and the effects of FGFRis on FGFR signaling in BC cells. (a) mRNA expression of FGFR1–4 in MCF-7, MDA-MB-231(SA) and MFM223 cells analyzed by qRT-PCR. The columns present the relative expression levels compared to the expression level of the housekeeping gene β-actin, calculated separately in each cell line. Statistical significances (one-way ANOVA with Tukey posthoc test) are shown as: ns, * p < 0.05, ** p < 0.01, *** p < 0.001. Note that the scale on the y axis is logarithmic. (b) Protein expression of FGFR1, FGFR2, FGFR3 and FGFR4 in MCF-7, MDA-MB-231(SA) and MFM223 cells detected by Western blot analysis. (c) Cells were serum starved and treated with FGF-2 for 10 min in the presence or absence of TKI258, BGJ398 and AZD4547 at the indicated concentrations. Cell lysates were analyzed for FRS2 and ERK1/2 phosphorylation levels using Western blotting. Alpha-tubulin and total ERK1/2 were used as a loading controls for MCF-7 and MFM223 cells, and for MDA-MB-231(SA) (abbreviated as MDA-231) cells, respectively

