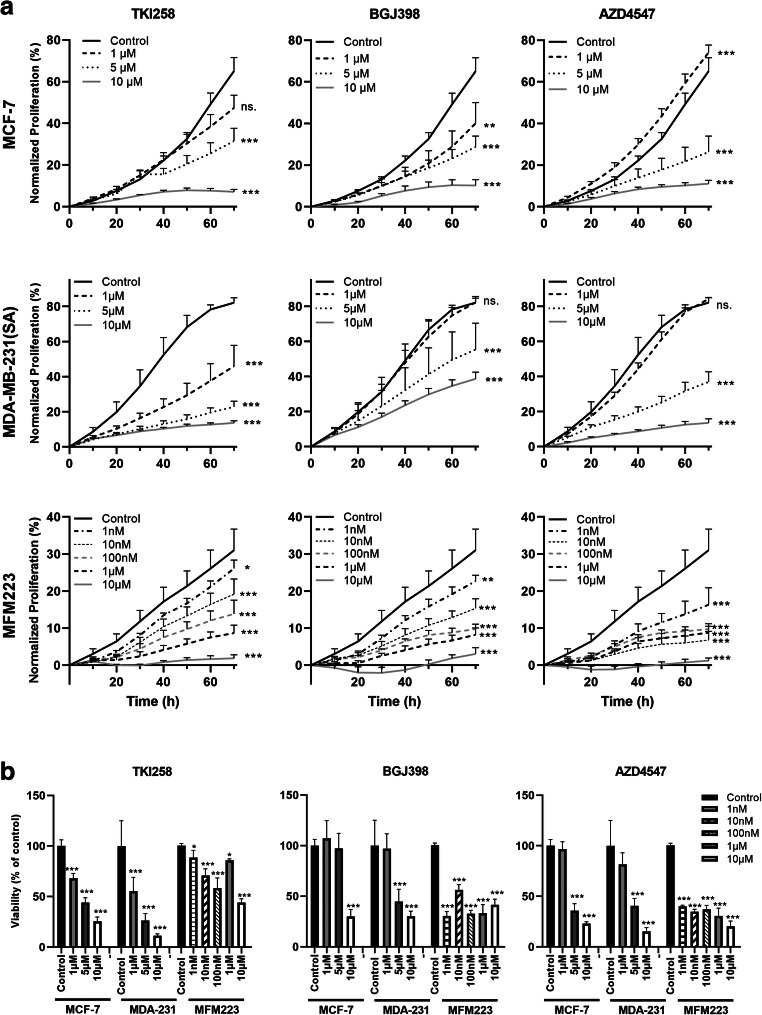
Fig. 2.
FGFRis decrease the proliferation of BC cells. (a) Proliferation of MCF-7, MDA- MB-231(SA) and MFM223 cells studied by measuring cell confluence using the IncuCyte ZOOM real-time imaging platform. One day after seeding, cells were treated with TKI258, BGJ398 or AZD4547 at the indicated concentrations and monitored up to 70 h. Confluence (%, mean ± SD, n = 8) was normalized to the corresponding value at 0 h (start of imaging). Statistical significances were analyzed for the area under the curve (AUC) over time and are shown compared to the control group (* p < 0.05, ** p < 0.01, *** p < 0.001). (b) Cells were treated as described above and viability was determined at the 70 h point using alamarBlue reagent. The columns represent the relative cell viabilities after 70 h FGFRi treatment compared to the control in each cell line (%, mean ± SD, n = 4–10). Statistical significances were determined using one-way ANOVA and adjusted for multiple comparison using Dunnett’s test, with the control group as reference. (* p < 0.05, ** p < 0.01, *** p < 0.001)

