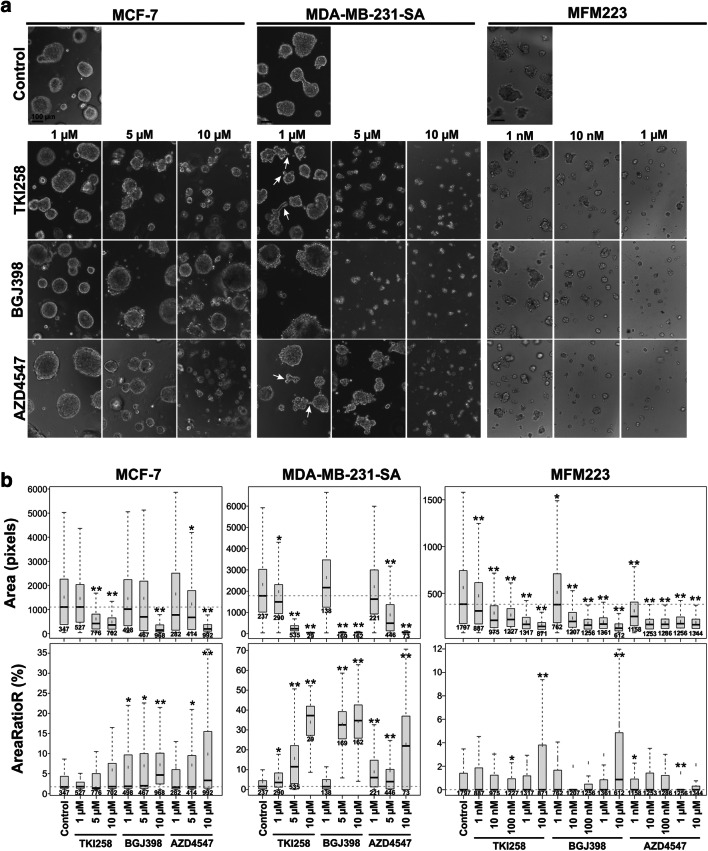
Fig. 3.
FGFRis affect BC cell organoid formation in an organotypic 3D culture model. MCF-7 and MDA-MB-231(SA) cells, and MFM223 cells were precultured in Matrigel for 3 or 4 days, respectively, and then treated with TKI258, BGJ398 or AZD4547 for 7 days and 6 days, respectively, at the indicated concentrations. (a) Representative phase-contrast images of cultures at the endpoint of the treatment. Magnification: 10x for MCF-7 and MDA-MB-231(SA) cells and 20x for MFM223 cells. Scale bar: 100 μm. (b) At the endpoint, cell organoids were stained with Calcein AM and EthD-1, imaged, and subjected to phenotypic analysis using AMIDA software. Object size (Area), reflecting the growth response and the overall viability of the cells, and the relative amount of red signal in an object (AreaRatioR), indicating cell death, are presented. Box-and-whisker plots highlight the medians (black horizontal line), means, 1.5 IQR and p-values (Bonferroni-corrected t-tests, * p < 0.05, ** p < 0.001), and the number of objects included in the analysis

