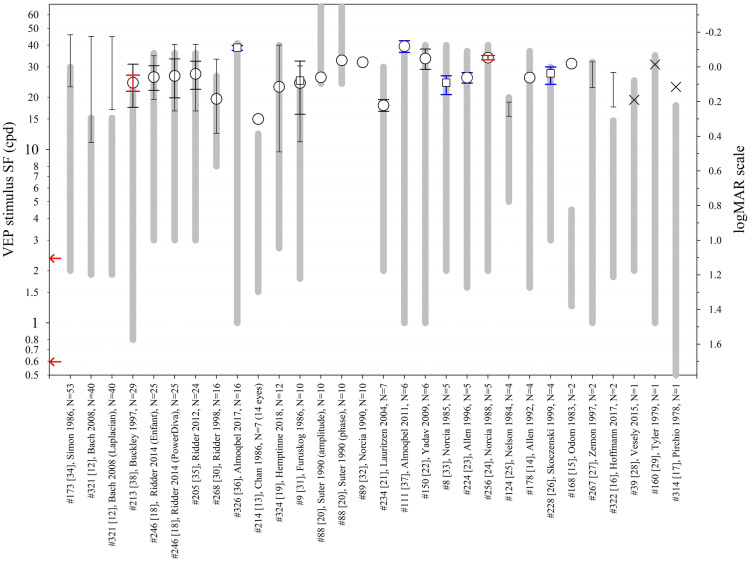
Fig. 2.
VEP stimuli SF ranges and limits (cpd) from healthy adults with normal or corrected-to-normal visual acuity as reported in 27 studies. The x-axis lists the publication and the number of subjects. Circles: mean. Squares: geometric mean. × : individual values. Lines with narrow ends: range. Black error bars (wide ends): SD. Red error bars: 95% confidence interval of mean. Blue error bars: SEM. Thick grey lines indicate the range of spatial frequencies presented or available. Arrows at the SF axis indicate the two ISCEV standard checkwidths, 60′ and 15′ (0.71 and 2.8 cpd; 1.63 and 1.026 in logMAR units) [66]

