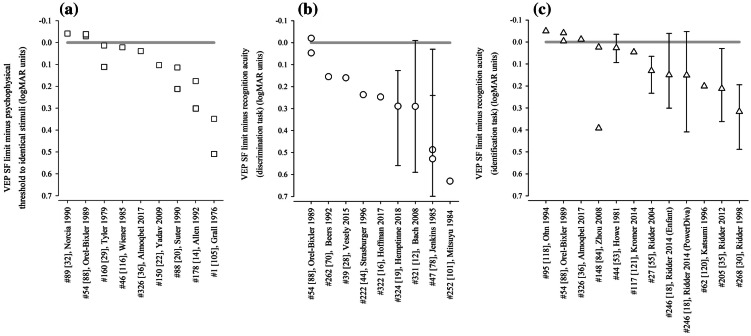
Fig. 5.
Illustration of studies reporting differences between VEP SF limits and behavioural thresholds in healthy adults using a psychophysical testing with VEP stimuli (Table 2); b recognition acuity based on a discrimination task (Table 3) and c recognition acuity based on an identification task (Table 4). Grey lines indicate no difference: points below the line indicate VEP SF limits are poorer than behavioural thresholds. Error bars indicate 95% limits of agreement (not always available)

