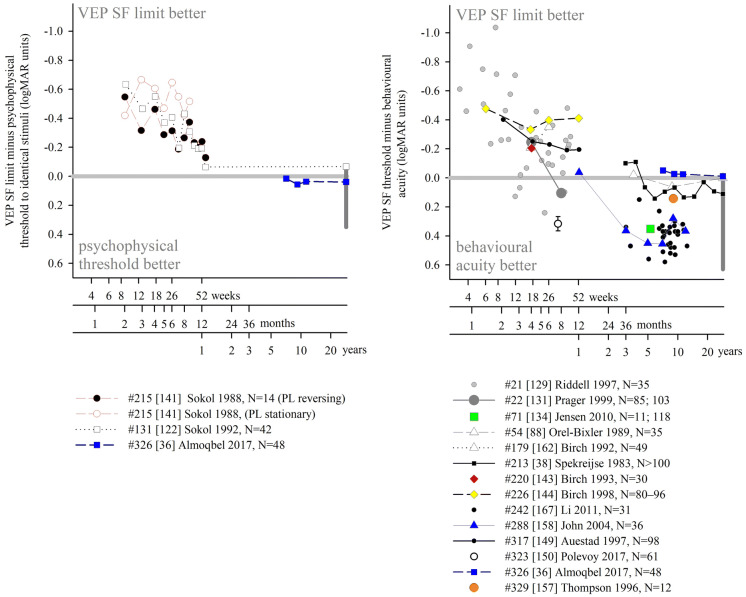
Fig. 7.
Illustration of difference between VEP SF limits and acuity and its change with age. Left panel: psychophysical acuity tests using identical stimuli to VEP test. Right panel: behavioural tests using age-appropriate clinical acuity tests. Solid grey horizontal line indicates no difference. Solid vertical line at adult ages indicates typical range of differences reported in healthy, normally sighted adults (see Fig. 5). Error bars represent SEM. PL: preferential-looking

