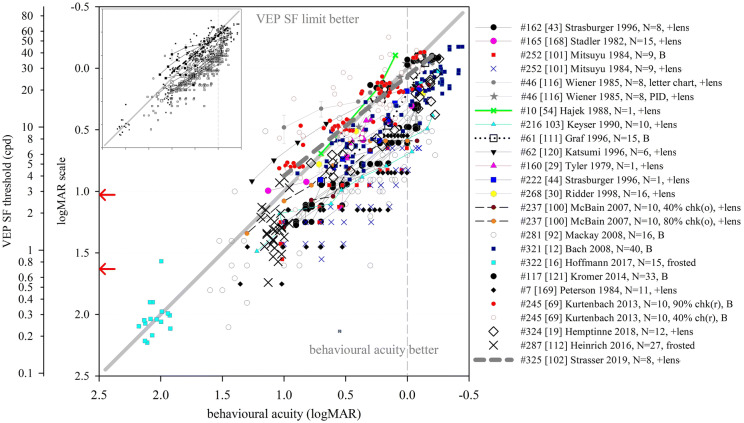
Fig. 8.
VEP SF limit versus behavioural acuity in healthy, normally sighted adults with artificially reduced acuity. Legend indicates study ID, number of subjects (N), and means of reducing acuity. Solid grey line: equality. Vertical dashed grey line: 0.0 logMAR. PID psychophysical test with stimuli identical to that used for VEP SF limit. Lines join symbols representing individual subjects if known, or join mean data from the same group of subjects. Where adjustments for behavioural versus VEP offsets were used [12, 16, 69, 112], these have been removed to allow comparison with unadjusted data from other studies. Red arrows at the SF axis indicate the two ISCEV standard checkwidths, 60′ and 15′ (0.71 and 2.8 cpd). Inset: the same data are presented to illustrate a closer VEP–behavioural match for those studies using extrapolation techniques (closed symbols) than those using the finest SF technique (open symbols)

