Figure 1.
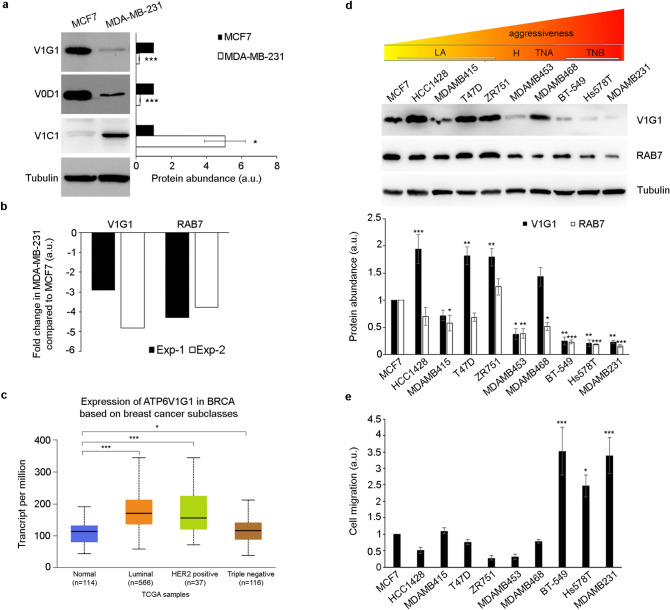
ATP6V1G1 gene expression in breast cancer cell lines. (a) Lysates of MCF7 and MDA-MB-231 cells analyzed by Western blot using specific anti-V1G1, anti-V0D1, anti-V1C1 and anti-tubulin antibodies. Data represent the mean ± s.e.m. of at least three experiments and statistical analysis was performed using Student’s t-test with MCF7 as referring sample. * = p < 0.05; *** = p < 0.001. (b) The amount of ATP6V1G1 and RAB7 transcripts was quantified, compared to the GAPDH transcript as control, using real-time PCR. The results of two independent experiments are shown (Exp-1 and Exp-2). (c) V1G1 expression data from the UALCAN database in breast cancer subclasses compared to normal breast tissues. *p ≤ 0.05; ***p ≤ 0.001. (d) Lysates of the indicated breast cancer cell lines, belonging to LA (luminal A), H (HER2 positive), TNA (triple negative A) and TNB (triple negative B) groups, were analyzed by Western blot using specific anti-V1G1, anti-RAB7, and anti-tubulin antibodies. (e) Wound healing assay of different breast cancer cell lines. Cells were imaged at the initial time point (T0) and 24 h after the scratch. Cell migration was measured as the ratio between closed area of the wound in MCF7 cells (referring sample set to 1) and each cell line. Data in panels d and e represent the mean ± s.e.m of at least three experiments and statistical analysis was performed using one-way ANOVA followed by Dunnett’s multiple comparisons test with control (MCF7 cells) as referring sample set to 1 (a.u. arbitrary unit). *p ≤ 0.05, **p ≤ 0.01, ***p ≤ 0.001.

