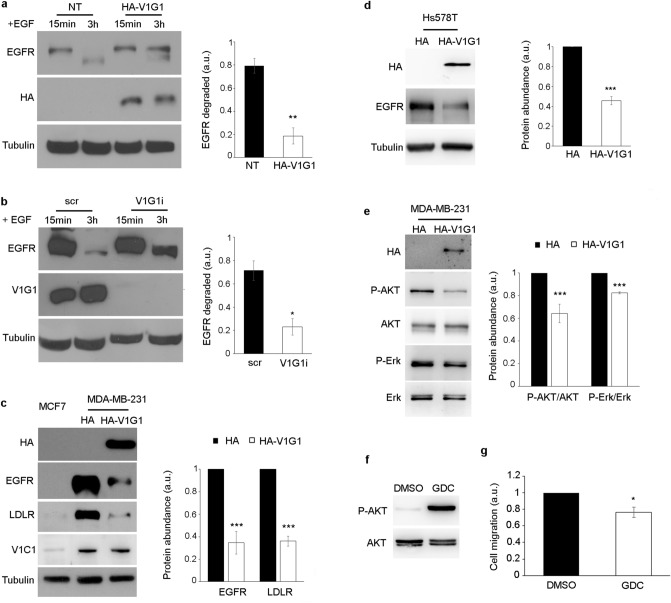
Figure 3.
V1G1 controls EGFR stability and signaling. HA-V1G1 overexpressing (a) or V1G1-depleted (b) HeLa cells were treated with 10 ug/ml of cycloheximide for 1 h and stimulated for 15 min or 3 h with 100 ng/ml EGF. Lysates were analyzed by Western blot using specific anti-EGFR, anti-HA, anti-V1G1 and anti-tubulin antibodies. The amount of EGFR degraded at 3 h was quantified using ImageJ software and plotted as a percentage of the respective intensity at 15 min. Values at 15 min were set to 1. (c) Lysates of MDA-MB-231 overexpressing HA-V1G1 and MCF7 cells were analyzed by Western blot using specific anti-HA, anti-EGFR, anti-LDLR, anti-V1C1, and anti-tubulin antibodies. Intensities of bands were measured by densitometry and normalized against tubulin. (d) Lysates of Hs578T cells overexpressing HA or HA-V1G1 were analyzed by Western blot using the indicated antibodies. Intensities of bands were measured by densitometry and normalized against tubulin. (e) Lysates of control (HA) and HA-V1G1 overexpressing MDA-MB-231 cells were analyzed by immunoblotting using the indicated antibodies. Bands were quantified by densitometry and normalized against total protein. (f) MDA-MB-231 cells treated for 24 h with 1 µM GDC-0068 were lysed and analyzed by Western blot using the indicated antibodies. (g) Cell migration was measured as the ratio between closed area of the wound in control cells incubated with DMSO (set to 1) and cells treated with GDC-0068. Data represent the mean ± s.e.m. of at least three experiments. Student’s t-test. *p ≤ 0.05, **p ≤ 0.01, ***p ≤ 0.001.

