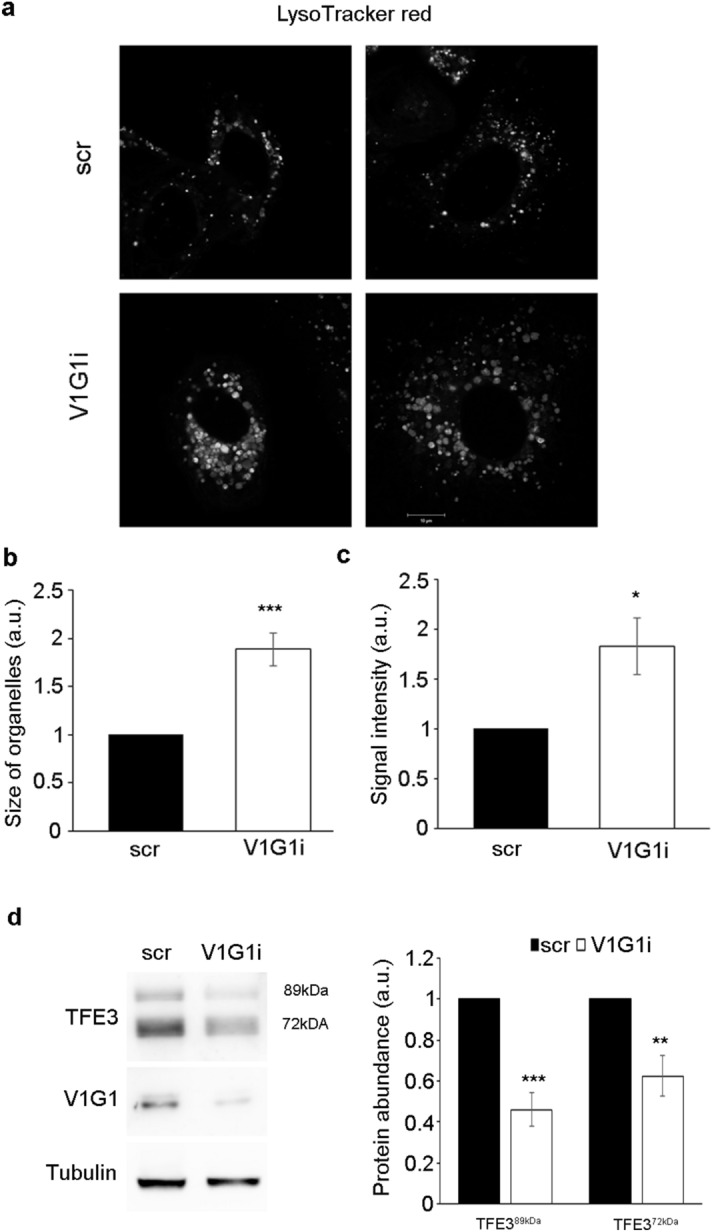
Figure 6.

V1G1 modulates late endocytic compartments in MCF7 cells. (a) V1G1-depleted MCF7 cells (V1G1i) were labeled with Lysotracker Red and analyzed by confocal microscopy, scale bar: 10 µm. (b) The size of organelles was quantified by ImageJ software. Data represent the mean ± s.e.m. (at least 4 independent experiments, ≥ 15 cells /sample for each experiment) ***p ≤ 0.001. (c) Lysotracker Red intensity was quantified by ImageJ software and Corrected Total Cell Fluorescence was calculated. Data represent the mean ± s.e.m. (at least 4 independent experiments, ≥ 15 cells/sample for each experiment) *p ≤ 0.01. (d) Relative protein abundance of the two active isoforms of TFE3 and V1G1 was assessed by western blotting, quantified by densitometry and normalizing against tubulin. Data represent the mean ± s.e.m of at least three independent experiments (*p ≤ 0.01, **p ≤ 0.01, ***p ≤ 0.001).
