
Table 3.
Difference in serum metabolites in FSGS remission versus recurrence measured by mass spectrometry.
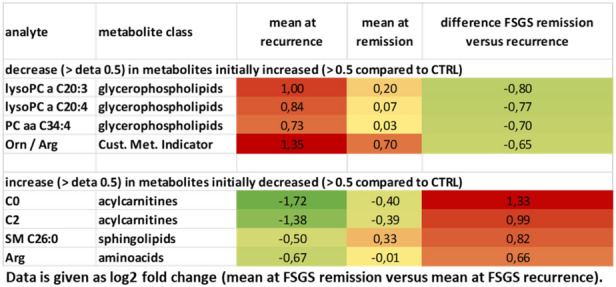
Table shows metabolites that were initially increased > 0.5 and decreased more than > 0.5 as well as metabolites that were initially decreased and increased more than > 0.5. All values are given as log2 (FSGS patient/stable transplanted control). The mean of two measurements at the time of FSGS relapse (before and after the 1. CytoSorb apheresis) to the mean of two measurements at the time of FSGS remission (before and after the CytoSorb apheresis at stable remission) were used for calculations.