Figure 5.
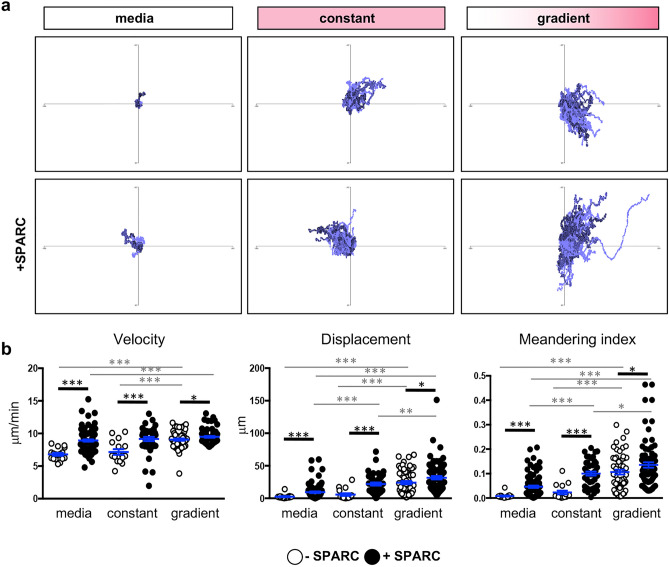
T cell migration is enhanced in the presence of SPARC in vitro. dsRed+ T cells were seeded in matrigel in the presence or absence of SPARC and the presence or absence of recombinant CCL21. Cell migration was imaged over 20 min in response to no chemokine, a constant concentration of chemokine, or a chemokine gradient. Videos of cell migration were analyzed. (a) Tracks of T cells migrating in response to media alone, a constant chemokine field, or in response to a gradient of CCL21 were normalized to begin at the origin to visualize migration trends. (b) Cell velocity, displacement, and meandering index were quantified using Volocity software and migration data was analyzed using the Mann–Whitney test. Data are representative of at least 2 individual experiments and are represented as mean ± SEM. Thick black lines indicate comparisons + / − SPARC, thin grey lines indicate comparison + / − chemokine. To simplify, only significant comparisons are annotated *p < 0.05, ***p < 0.001.

