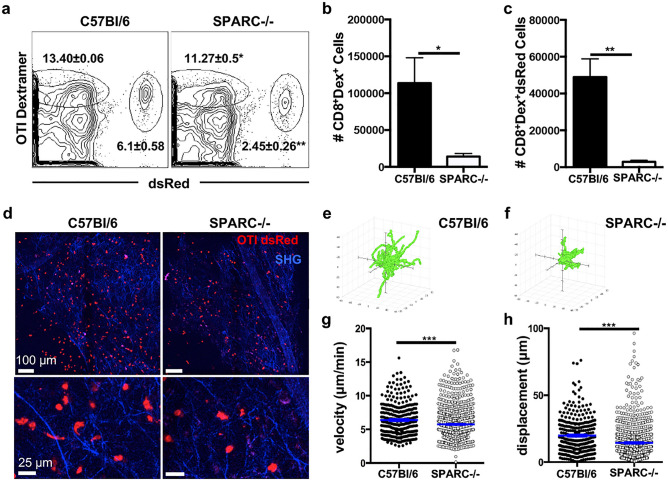
Figure 7.
SPARC facilitates optimal CD8 + T cell migration in the brain. C57Bl/6 and SPARC−/− mice were infected with Pru-OVA for 21 days before receiving 5 × 10⁶ OVA specific dsRed+CD8+ T cells. Analyses were conducted one week post transfer. (a) Flow cytometry plots of endogenous (left gate) and transferred OVA specific dsRed T cells (right gate) isolated from the whole brain of chronically infected C57Bl/6 and SPARC−/− mice. (b) Absolute cell numbers of endogenous OVA specific T cells calculated from the frequencies presented in (a). (c) Absolute cell numbers of transferred dsRed+ OVA-specific T cells calculated from the frequencies presented in a. (d) 2 × 2 tiled images were taken of the cortex using two-photon microscopy to visualize the distribution of T cells infiltrating the brain (e–h) Videos imaged of cell migration in the infected brain were analyzed. Flower plots of cell tracks from C57Bl/6 (e) and SPARC−/− (f) normalized to the origin. Velocity (g) and displacement (h) for cells recruited to C57Bl/6 brains compared to cells migrating in SPARC−/− brains were quantified. Cells were tracked using Volocity software and migration data was analyzed using the Mann–Whitney test, ***p < 0.001. Flow cytometry data was analyzed using the student’s T test, *p < 0.05, **p < 0.01. Data are representative of at least 2 individual experiments with a minimum of n = 3 and are represented as mean ± SEM.

