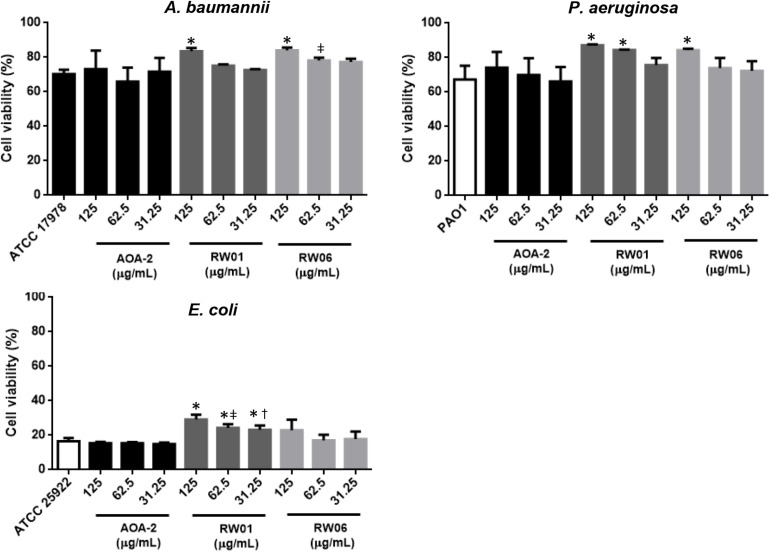
FIGURE 3.
Cell viability assay of A. baumannii ATCC 17978, P. aeruginosa PAO1, and E. coli ATCC 25922 at different concentrations of AOA-2 and its derivatives RW01 and RW06. ∗compared to the untreated bacteria, μcompared to AOA-2 at 62.5 μg/mL, †compared to AOA-2 at 31.25 μg/mL, Student’s t-test with P < 0.05.

