Figure 2.
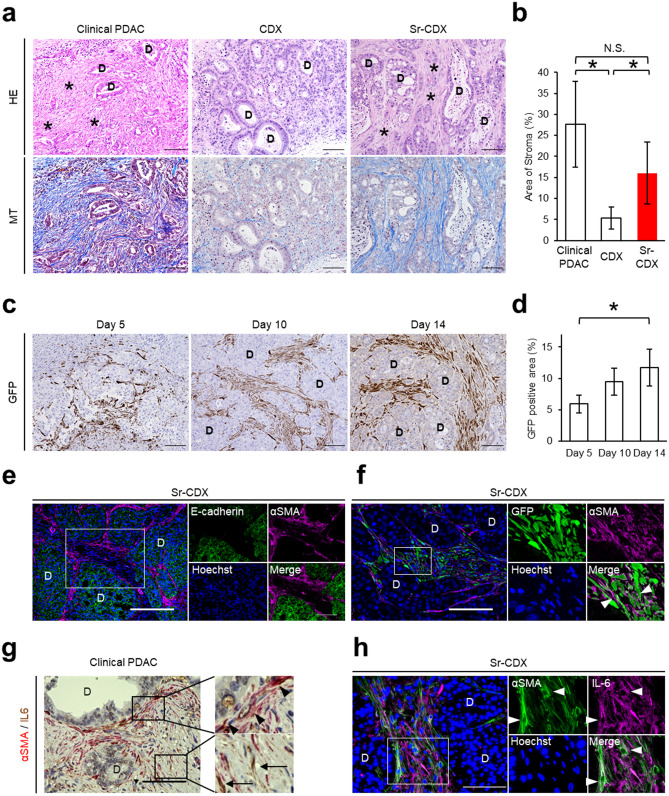
Co-transplantation of adipose-derived human MSCs recapitulated the histological morphology of human PDAC. (a) Representative images of H&E staining and Masson’s trichrome staining in clinical PDACs, the CDX model, and the Sr-CDX model. D, cancer duct formation. *, stromal area. Scale bars, 100 µm. (b) Quantification of the stromal area in clinical PDACs, CDX, and Sr-CDX groups. Results show the mean ± SD (n = 5). *P < 0.05, one-way ANOVA with Tukey's method. N.S., not significant. (c) Representative IHC image of GFP in Sr-CDX tumors at days 5, 10, and 14. Hematoxylin (blue) was used as a nuclear counterstain. D, cancer duct structure. Scale bars, 100 µm. (d) Quantification of the GFP-positive area in each group (n = 5). Results show the mean ± SD *P < 0.05, one-way ANOVA with Tukey's method. (e and f) Representative IF image of Sr-CDX tumors. Left, a zoomed-out image. The small plots on the right show a magnification of the depicted area within the selection (white rectangle). D, cancer duct structure. (e) Each plot is stained for E-cadherin (green), αSMA (magenta), and Hoechst 33,342 (blue). Scale bar, 100 µm. (f) Each plot is stained for αSMA (magenta), GFP (green), and Hoechst 33,342 (blue). Arrowheads indicate both αSMA- and GFP-positive cells. Scale bar, 50 µm. (g) Representative IHC image of human PDAC stained for αSMA (red) or IL-6 (brown). Hematoxylin (blue) was used as a nuclear counterstain. Left, a zoomed-out image. The small plots on the right show a magnification of the area depicted in the selection (black rectangle). Arrowheads indicate αSMA-positive CAFs. Arrows indicate IL-6-positive CAFs. D, cancer duct structure. Scale bar, 100 µm. (h) Representative IF image of Sr-CDX tumors. Left, a zoomed-out image. The small plots on the right show a magnification of the area depicted in the selection (white rectangle). Each plot is stained for αSMA (green), IL-6 (magenta), and Hoechst 33,342 (blue). Arrowheads indicate both αSMA- and IL-6-positive CAFs. D, cancer duct structure. Scale bar, 100 µm.

