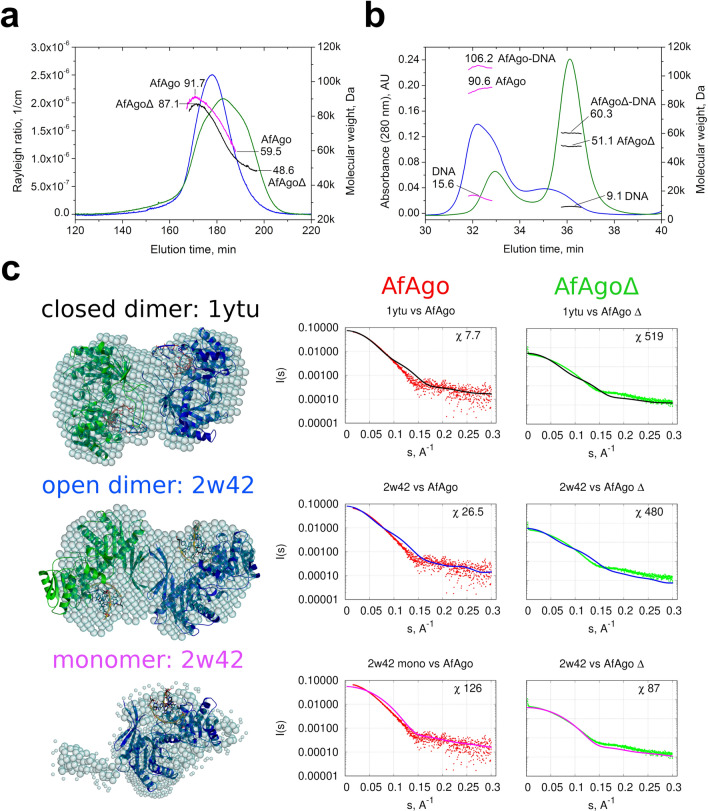
Figure 2.
SEC-MALS and SAXS analysis of apo-AfAgo and AfAgo-DNA complexes. (a) SEC-MALS analysis of WT AfAgo and dimerization mutant AfAgoΔ unbound to nucleic acids. The light scattering data (blue for WT AfAgo, green for AfAgoΔ) is shown along with the calculated Mw values (magenta for WT, black for mutant). The highest and lowest Mw values calculated for each protein are indicated. Theoretical Mw of WT AfAgo monomer is 50.8 kDa, theoretical Mw of AfAgoΔ monomer is 49.9 kDa. (b) SEC-MALS analysis of AfAgo-DNA and AfAgoΔ-DNA complexes. The UV absorption data of AfAgo-DNA (blue) and AfAgoΔ-DNA (green) is shown along with the Mw values of full complexes, the protein component, and the DNA component (magenta for AfAgo-DNA sample and black for AfAgoΔ-DNA sample, respectively). The theoretical Mw of a 2:2 WT AfAgo:DNA complex is 119 kDa (2 × 50.8 + 2 × 8.7 kDa), theoretical Mw of a 1:1 AfAgoΔ-DNA complex is 58.6 kDa (49.9 + 8.7 kDa). (c) SAXS data of WT AfAgo complex with MZ-1289 DNA (red points) and the dimerization mutant AfAgoΔ with MZ-1289 DNA (green points) are compared with the scattering curves generated from the “closed” dimer with dsRNA (PDB ID: 1ytu, black curves), “open” dimer (PDB ID: 2w42, blue curves) and AfAgo-DNA complex (PDB ID: 2w42, magenta curves) by CRYSOL. Corresponding AfAgo structures are shown in the second column superimposed with the dummy atom models generated using the SAXS data of the AfAgo complex with MZ-1289 oligoduplex.

