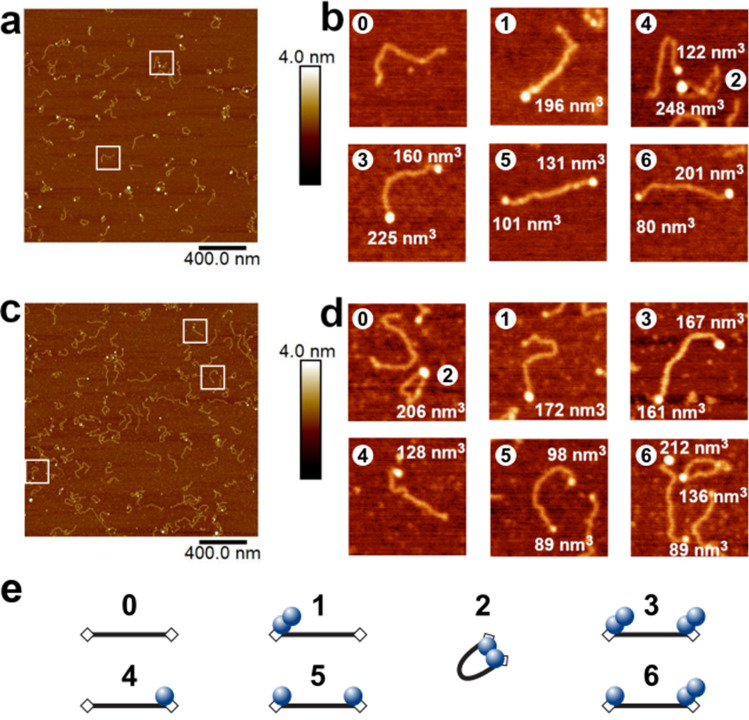
Figure 3.
Visualization of AfAgo-induced DNA loops by AFM. Representative AFM images and fourfold enlarged views of WT AfAgo-DNA (a,b) and AfAgoΔ-DNA (c,d) complexes adsorbed to APS-mica acquired in the air are shown, along with calculated protein volumes. Area of each image in the (a,c) is 4 µm2, scale bar is 400 nm, the Z range is 4 nm; the Z range of images in (b,d) is 3.0 nm. Regions marked by white squares in (a,c) indicate several of the observed protein–DNA complexes enlarged in (b,d). Based on protein volumes, we assign AfAgo-DNA complexes shown in (b,d) to different protein–DNA stoichiometries and arrangements (numbered from 0 to 6) that are schematically depicted in (e): “0”—naked DNA; “1”—AfAgo dimer bound to one DNA end; “2”—AfAgo dimer forming a DNA loop; “3”—two AfAgo dimers on different DNA ends; “4”—an AfAgo monomer on one DNA end; “5”—two AfAgo monomers on different DNA ends; “6”—a monomer and a dimer on different DNA ends.

