
Figure 6.
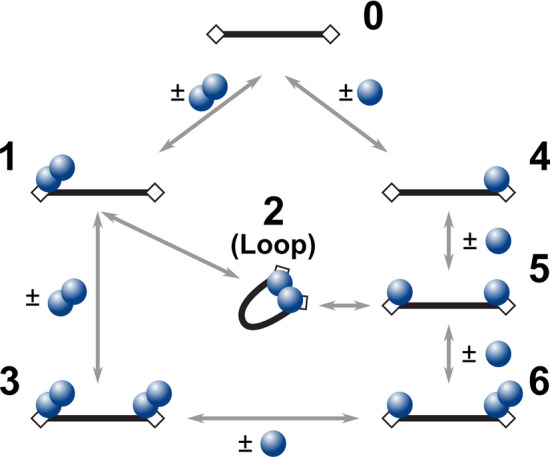
Kinetic schemes depicting possible reaction pathways between a two-target site DNA fragment and WT AfAgo. Black bars represent DNA, rectangular boxes—AfAgo-binding targets (phosphorylated DNA ends), blue circles—AfAgo monomers. Numbering of various protein–DNA assemblies matches numbering of complexes observed by AFM (Fig. 3). Note that species 1 and 6 may be formed via alternative pathways not depicted in the scheme (species 1 may be formed when two monomers associate consecutively with the same DNA end; species 6 may be formed when a monomer and a dimer associated with different DNA ends).