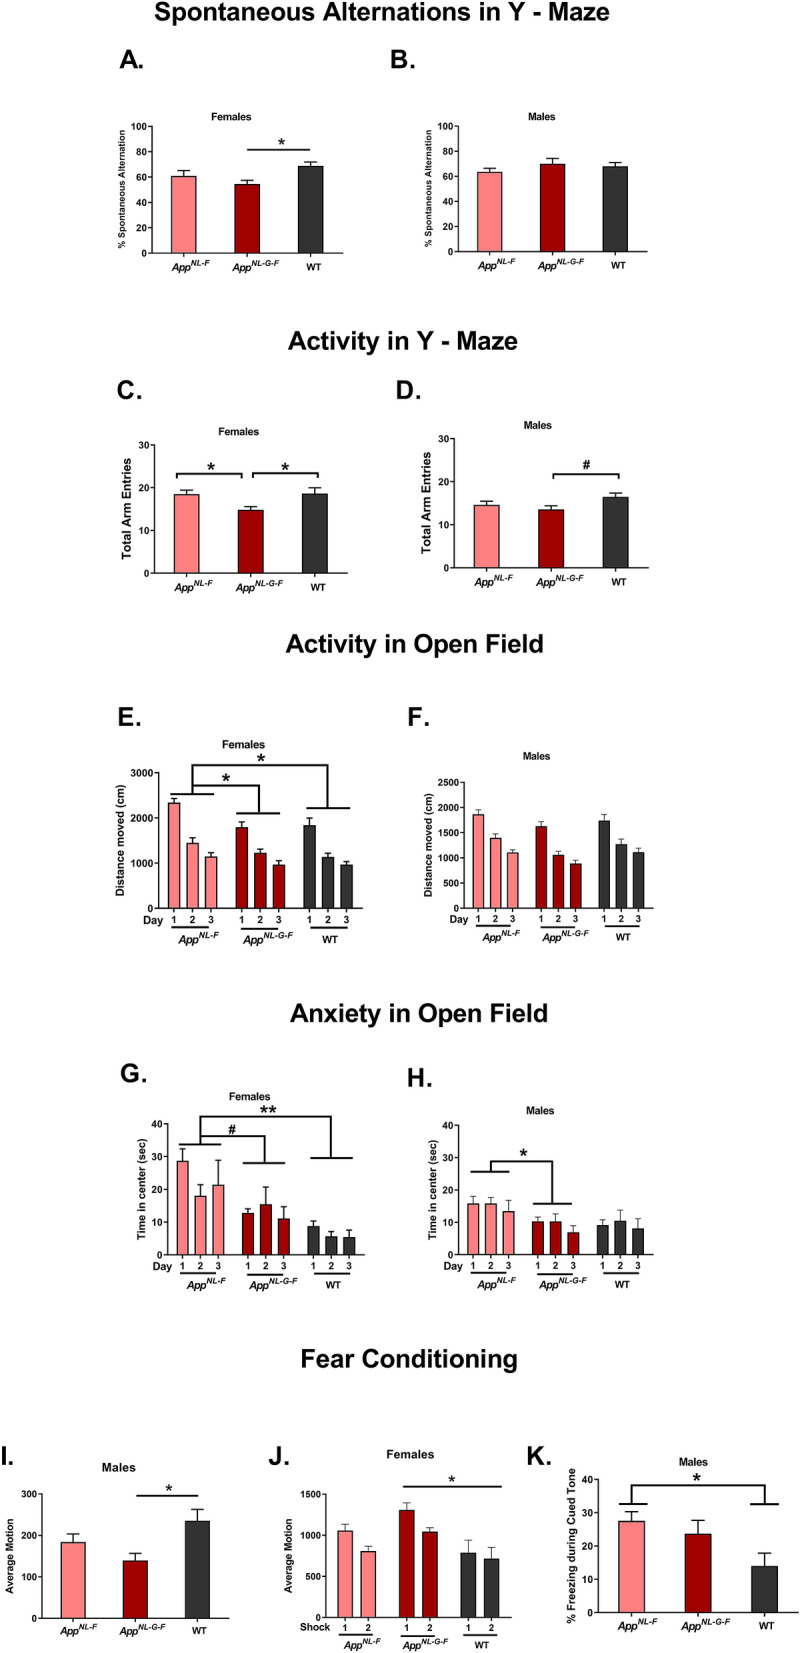
Figure 2.

Behavioral and cognitive performance of AppNL-G-F, AppNL-F, and WT female (left panels) and male (right panels) mice. The data are shown as mean ± SEM. (A) The percent spontaneous alternation in the Y maze was lower in AppNL-G-F than WT females. *p = 0.0166. (B) There was no effect of genotype on spontaneous alternations in the males. (C) The number of entries in AppNL-G-F female mice was lower than in WT and AppNL-F females. *p < 0.05. (D) There was a trend towards a lower number of entries in AppNL-G-F than WT males #p = 0.0537. (E) WT and AppNL-G-F females moved significantly less than AppNL-F females. *p < 0.05. (F) There was no effect of genotype in activity levels in the Y maze. (G) AppNL-F females spent more time in the center of the open field than WT females. There was a trend towards AppNL-G-F spending more time in the center of the open field than WT females. **p = 0.003; #p = 0.063. (H) AppNL-G-F males spent less time in the center than AppNL-F males. *p = 0.0364. (I) AppNL-G-F male mice moved less than WT male mice during the baseline period in the fear conditioning test. *p = 0.01. (J) In females, AppNL-G-F mice moved more during the shocks than WT mice. *p = 0.005. Freezing during the inter-stimulus intervals (ISI’s) was assessed as a measure of fear learning. (K) Male AppNL-F mice froze significantly more during the tone in the cued fear memory test than WT male mice. *p = 0.031. AppNL-G-F mice: n = 13 females and 14 males; AppNL-F mice: n = 11 females and 14 males; WT mice: n = 11 females and 11 males.
