Figure 4.
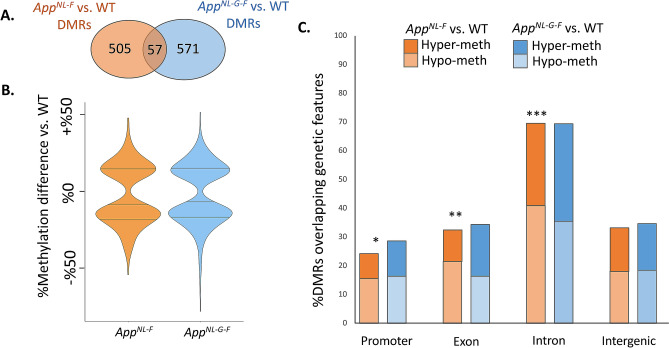
Several differentially methylated regions (DMRs) are found in the genomes of AppNL-F and AppNL-G-F mice when compared to WT. (A) A Venn diagram shows the number of unique and shared DMRs in each pair-wise comparison. (B) Violin plots demonstrate distribution of methylation differences among the DMRs in each genotype compared to WT controls. (C) Percentage of DMRs overlapping each genetic feature is shown. DMRs overlapping more than one feature are included in the counts for each overlapping feature. Proportions of hypo- and hypermethylated DMRs are shown on each bar. Groups with significant deviation from 50:50 split between hypo- and hypermethylated DMRs are marked with asterisk (*p < 0.05, **p < 0.005, and ***p < 0.0005). AppNL-G-F mice: n = 5; AppNL-F mice: n = 5; and WT mice: n = 4.

