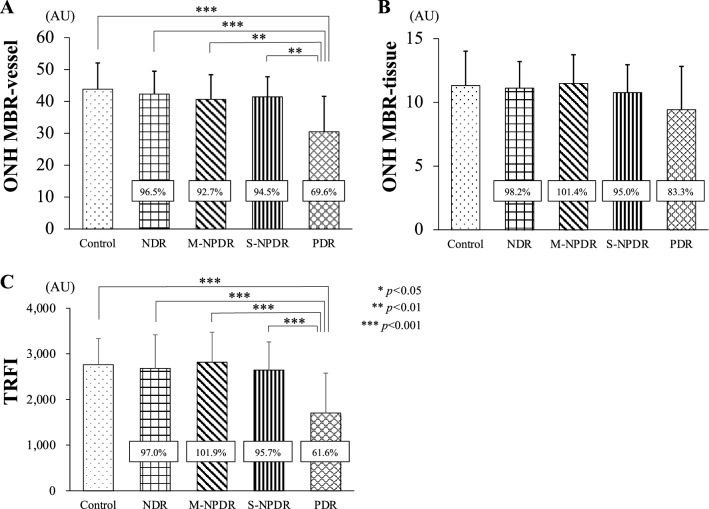
Figure 5.
Differences in blood flow parameters determined by LSFG among the groups. The percentage differences are shown for four groups with diabetes and compared to the control group. The MBR of the vessels on the ONH in the PDR group is significantly lower than that in the other groups (A). There is no significant difference in the MBR-tissue among the groups (B). The total retinal flow index (TRFI) in the PDR group is significantly lower than the other groups (C).

