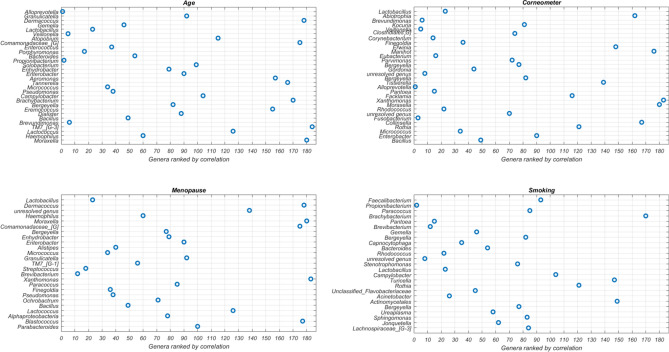
Figure 3.
Feature ranking from statistical test. Visualization of the most impactful genera per phenotype. On the y-axis the ranked impactful genera as generated by SHAP (the most impactful genus at the top) are shown. On the y-axis the rankings in independent statistical tests (the most significant (smallest p-value) genus is on the left) are shown. Note that the total number of genera is 186. This image has been generated using Matlab R2017a at https://www.mathworks.com/products/matlab.html.

