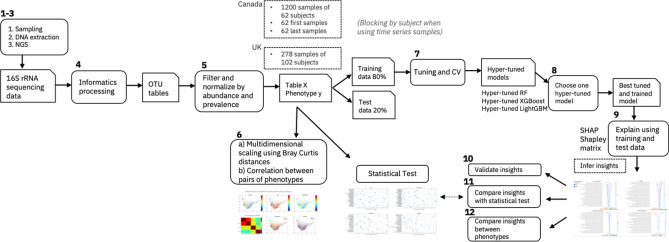
Figure 4.
Explainable AI (EAI) approach for microbiome data. This figure shows the main steps (1–12) of our workflow. The main steps include microbiome sampling and 16S rRNA sequencing (1–3), bioinformatic pre-processing (4), filtering of the resulting OTUs tables (5), multi-dimensional scaling of pairwise Bray–Curtis dissimilarities between samples performed on different subsets of the Canada cohort, and phenotype correlations (6); hyper-parameter tuning and cross validation of each ML model (RF, XGBoost and LightGBM) using the training dataset to predict the host phenotype from different subsets of the Canada and UK cohorts—blocking by subject when using time series samples (7); training each of the fine-tuned ML models (hyper-tuned RF, XGBoost and LightGBM) on the training data and testing it on the test data. To provide explanations, choose the best performing hyper-tuned and trained model (e.g., tuned LightGBM) for each cohort (8); explaining the predictions of the chosen model using the training and the test data (9), validating the insights inferred from the model explanations against the literature (10), performing statistical testing for feature ranking and finally comparing the insights from the statistical test to the insights inferred by using the explainability algorithm method (SHAP) (11), comparing the inferred insights on the impactful genera across different phenotypes (12).

