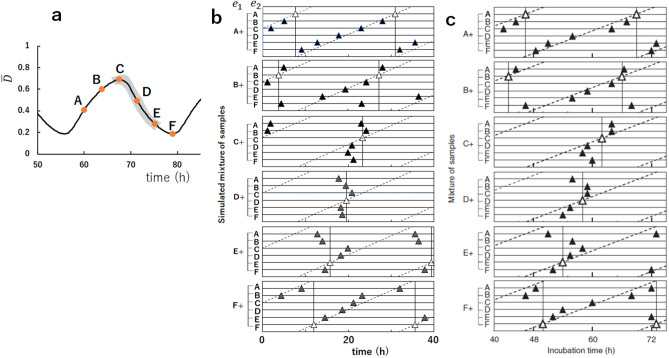
Figure 4.
The simulated mixing of two ensembles oscillating in different phases from A to F. (a) Six phases, A to F, were selected from the simulated curve of the phosphorylation level . The simulated results show that the phase of the oscillations of the mixture ensemble are entrained into the phase of gray shaded region. (b) Time when the peaks of appeared after mixing two samples, and , is plotted by triangles. White triangles when the same samples were mixed, and filled triangles when samples in different phases were mixed. In each of six panels, the phase of was fixed and the phase of was varied from A to F. In (a) and (b), parameters are the same as in Fig. 3. (c) The plot of the experimental data corresponding to (b). Copied from Ref.13 with permission.

