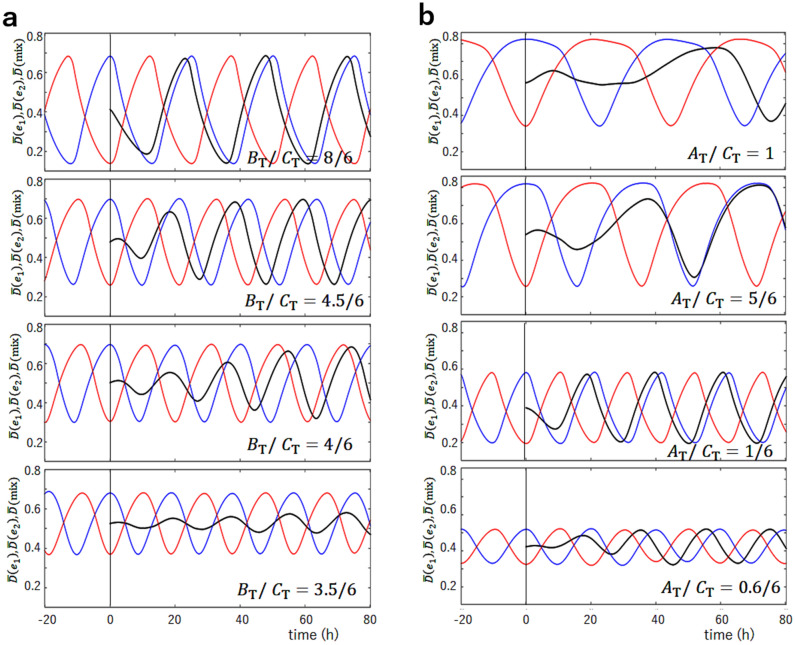
Figure 5.
The simulated mixing of two ensembles, at the lowest phosphorylation level and at the highest phosphorylation level. The phosphorylation level of , (red), and the phosphorylation level of , (blue), are superposed with the phosphorylation level after mixing, (black). and were mixed at designated by a vertical line. (a) The ratio of the concentration of KaiB over the concentration of KaiC on a monomer basis, , is varied from the standard value of . (b) The ratio of the concentration of KaiA over the concentration of KaiC on a monomer basis, , is varied from the standard value of . Other parameters are the same as in Fig. 3.

