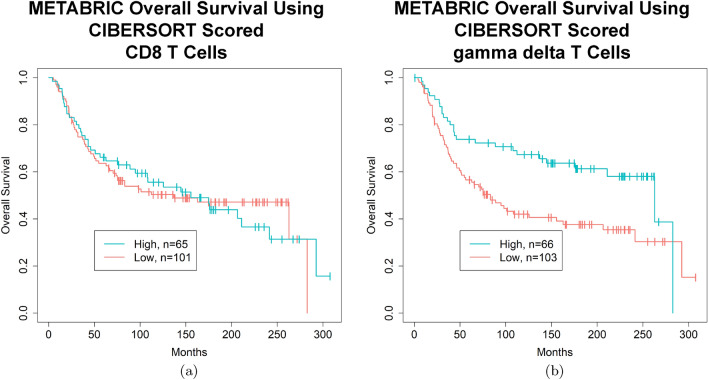
Figure 10.
Kaplan–Meier curves demonstrating improvements in OS in METABRIC TNBC patients with high quantities of gamma delta T cells in their tumor sample. (a) METABRIC TNBC patients with a higher proportion of CD8 T cells in their tumor do not have a better OS (p = 0.98, FDR = 0.98, log rank test) (survival rates high vs. low, 5 year: 66.2% and 63.5%, 10 year: 55.6% and 50.3%). (b) METABRIC TNBC patients with a higher proportion of gamma delta T cells in their tumor sample have a better OS (p = 0.0059, FDR = 0.12, log rank test) (survival rates high vs. low, 5 year: 73.9% and 56.6%, 10 year: 67.3% and 42.0%). (a) and (b) High and low cut offs of T cell infiltrate were chosen as quantities above and below 0.25 times the standard deviation of the mean, respectively. (a) and (b) Images generated with R 4.0.2 (https://www.R-project.org)35.

