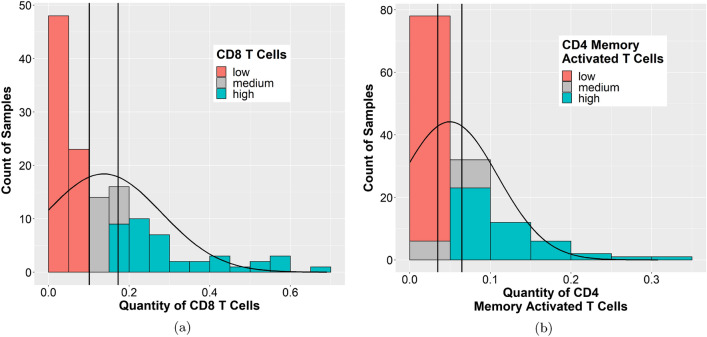
Figure 3.
Distribution of the proportion of CD8 T cells or CD4 memory activated T cells across the TCGA TNBC cases. A histogram of the quantity of (a) CD8 T cells or (b) CD4 memory activated T cells present across the different TCGA TNBC samples was plotted using data generated by CIBERSORT. CIBERSORT assigns a score of arbitrary units that reflects the absolute proportion of each cell type in a mixture. A higher score would indicate a higher proportion of that cell type. Vertical lines represent the cut off (± 0.25 * standard deviation) used to create the “high” and “low” groups. (a) and (b) Images generated with R 4.0.2 (https://www.R-project.org)35.

